The researcher’s complete guide to soil moisture
Everything you need to know about measuring soil moisture—all in one place.
An ecologist installed an extensive soil moisture sensor network to study the effect of slope orientation on plant available water. He collected reams of soil moisture data, but ultimately he was frustrated because he couldn’t tell how much of the water was available to plants.
He’s not alone in his frustration. Accurate, inexpensive soil moisture sensors have made soil moisture a justifiably popular measurement, but as many people have discovered, a good hammer doesn’t make every soil water problem a nail. Water content can only show how much water there is. Hydraulic conductivity shows how fast water can move. But water potential shows if water is available to plants, whether it will move, and where it’s going to go.
To understand water potential and why you need it, it’s necessary to explain extensive vs. intensive properties. Most people look at soil moisture only in terms of one variable: soil water content. But two types of variables are necessary to describe the state of matter or energy in the environment. An extensive variable describes the extent (or amount) of matter or energy. And the intensive variable describes the intensity (or quality) of matter or energy.
| Extensive Variable | Intensive Variable |
|---|---|
| Volume | Density |
| Water content | Water potential |
| Heat content | Temperature |
Table 1. Examples of extensive and intensive variables
Soil water content is an extensive variable. It describes how much water is in the environment. Soil water potential is an intensive variable. It describes the intensity or quality (and in most cases the availability) of water in the environment. To understand how this works, think of extensive vs. intensive variables in terms of heat. Heat content (an extensive variable) describes how much heat is stored in a room. Temperature (an intensive variable) describes the quality (comfort level) or how your body will perceive the heat in that room.
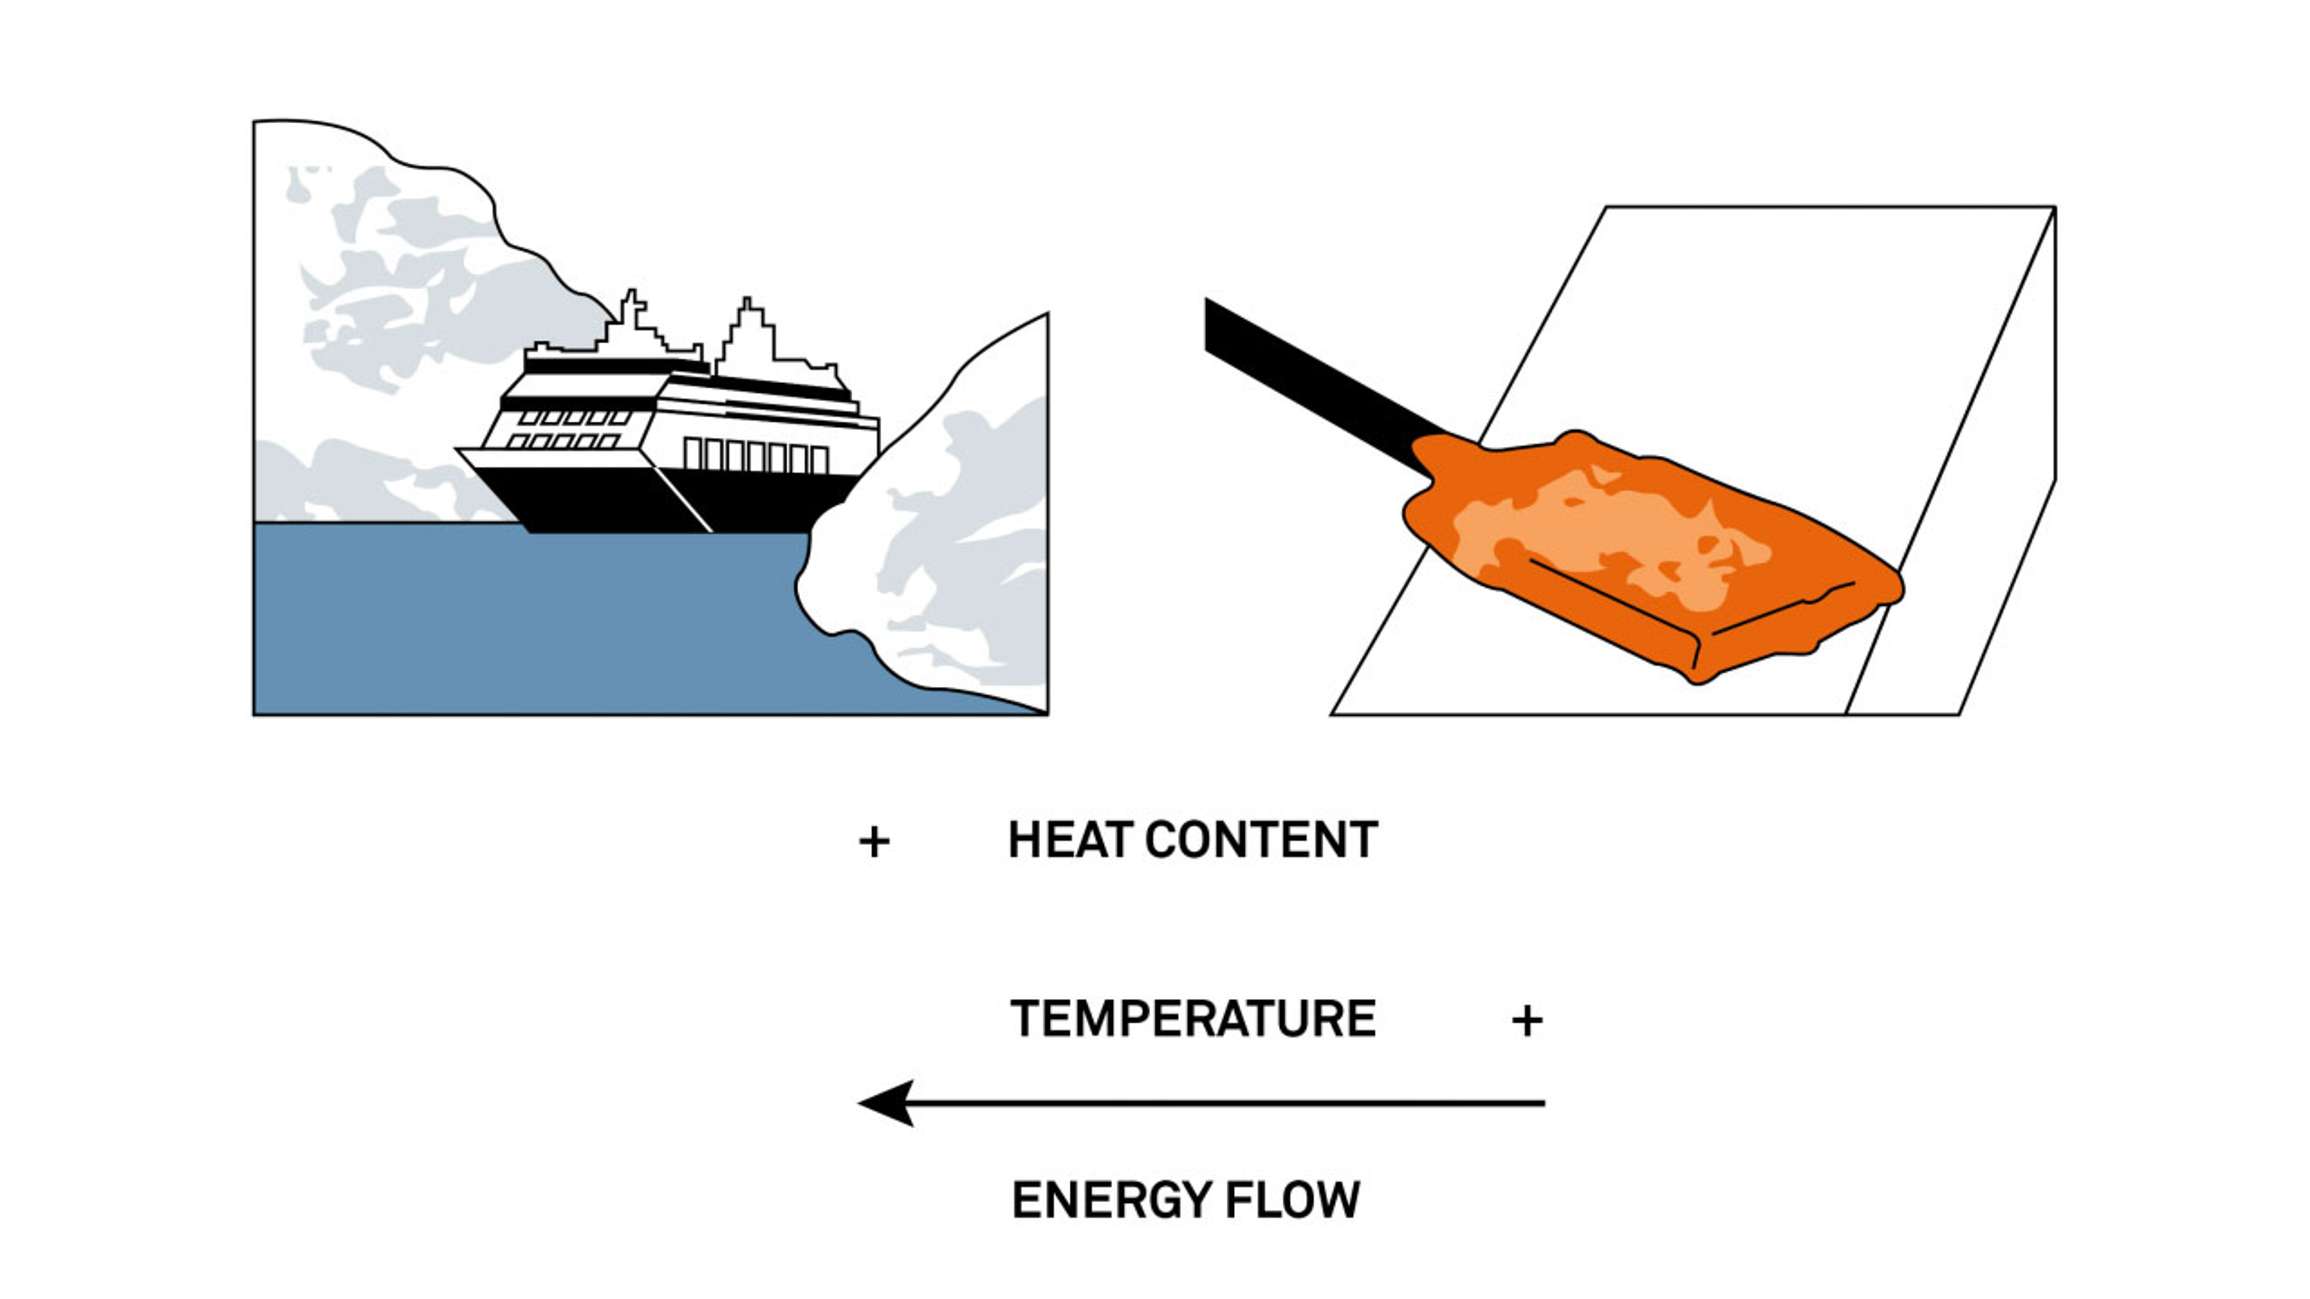
Figure 1 shows a large ship in the arctic vs. a hot rod that’s just been heated in a fire. Which of these two items has a higher heat content? Interestingly, the ship in the arctic has a higher heat content than the hot rod, but it’s the rod that has a higher temperature. If we put the hot rod in contact with the ship, which variable governs how the energy will flow? The intensive variable, temperature, governs how energy will move. Heat always moves from a high temperature to a low temperature.
Learn more about intensive vs. extensive variables.
Similar to heat content, water content is an amount. It’s an extensive variable. It changes with size and situation. Consider the following paradoxes:
In these and many other cases, water content data are confusing because they don’t predict how water moves. Water potential measures the energy state of water and thus explains realities of water movement that otherwise defy intuition. Just as temperature defines the comfort level of a human, water potential defines the comfort level of a plant. If the water potential is known, it’s possible to predict whether plants will grow well or be stressed in any environment.
Water content is not an indicator of plant “comfort” because soil, clay, sand, potting soil, and other media, all hold water differently. Imagine a sand with 30% water content. Due to its low surface area, the sand will be too wet for optimal plant growth, threatening a lack of aeration to the roots, and flirting with saturation. Now consider a fine-textured clay at that same 30% water content. The clay may appear only moist and be well below optimum “comfort” for a plant due to the surface of the clay binding the water and making it less available to the plant.
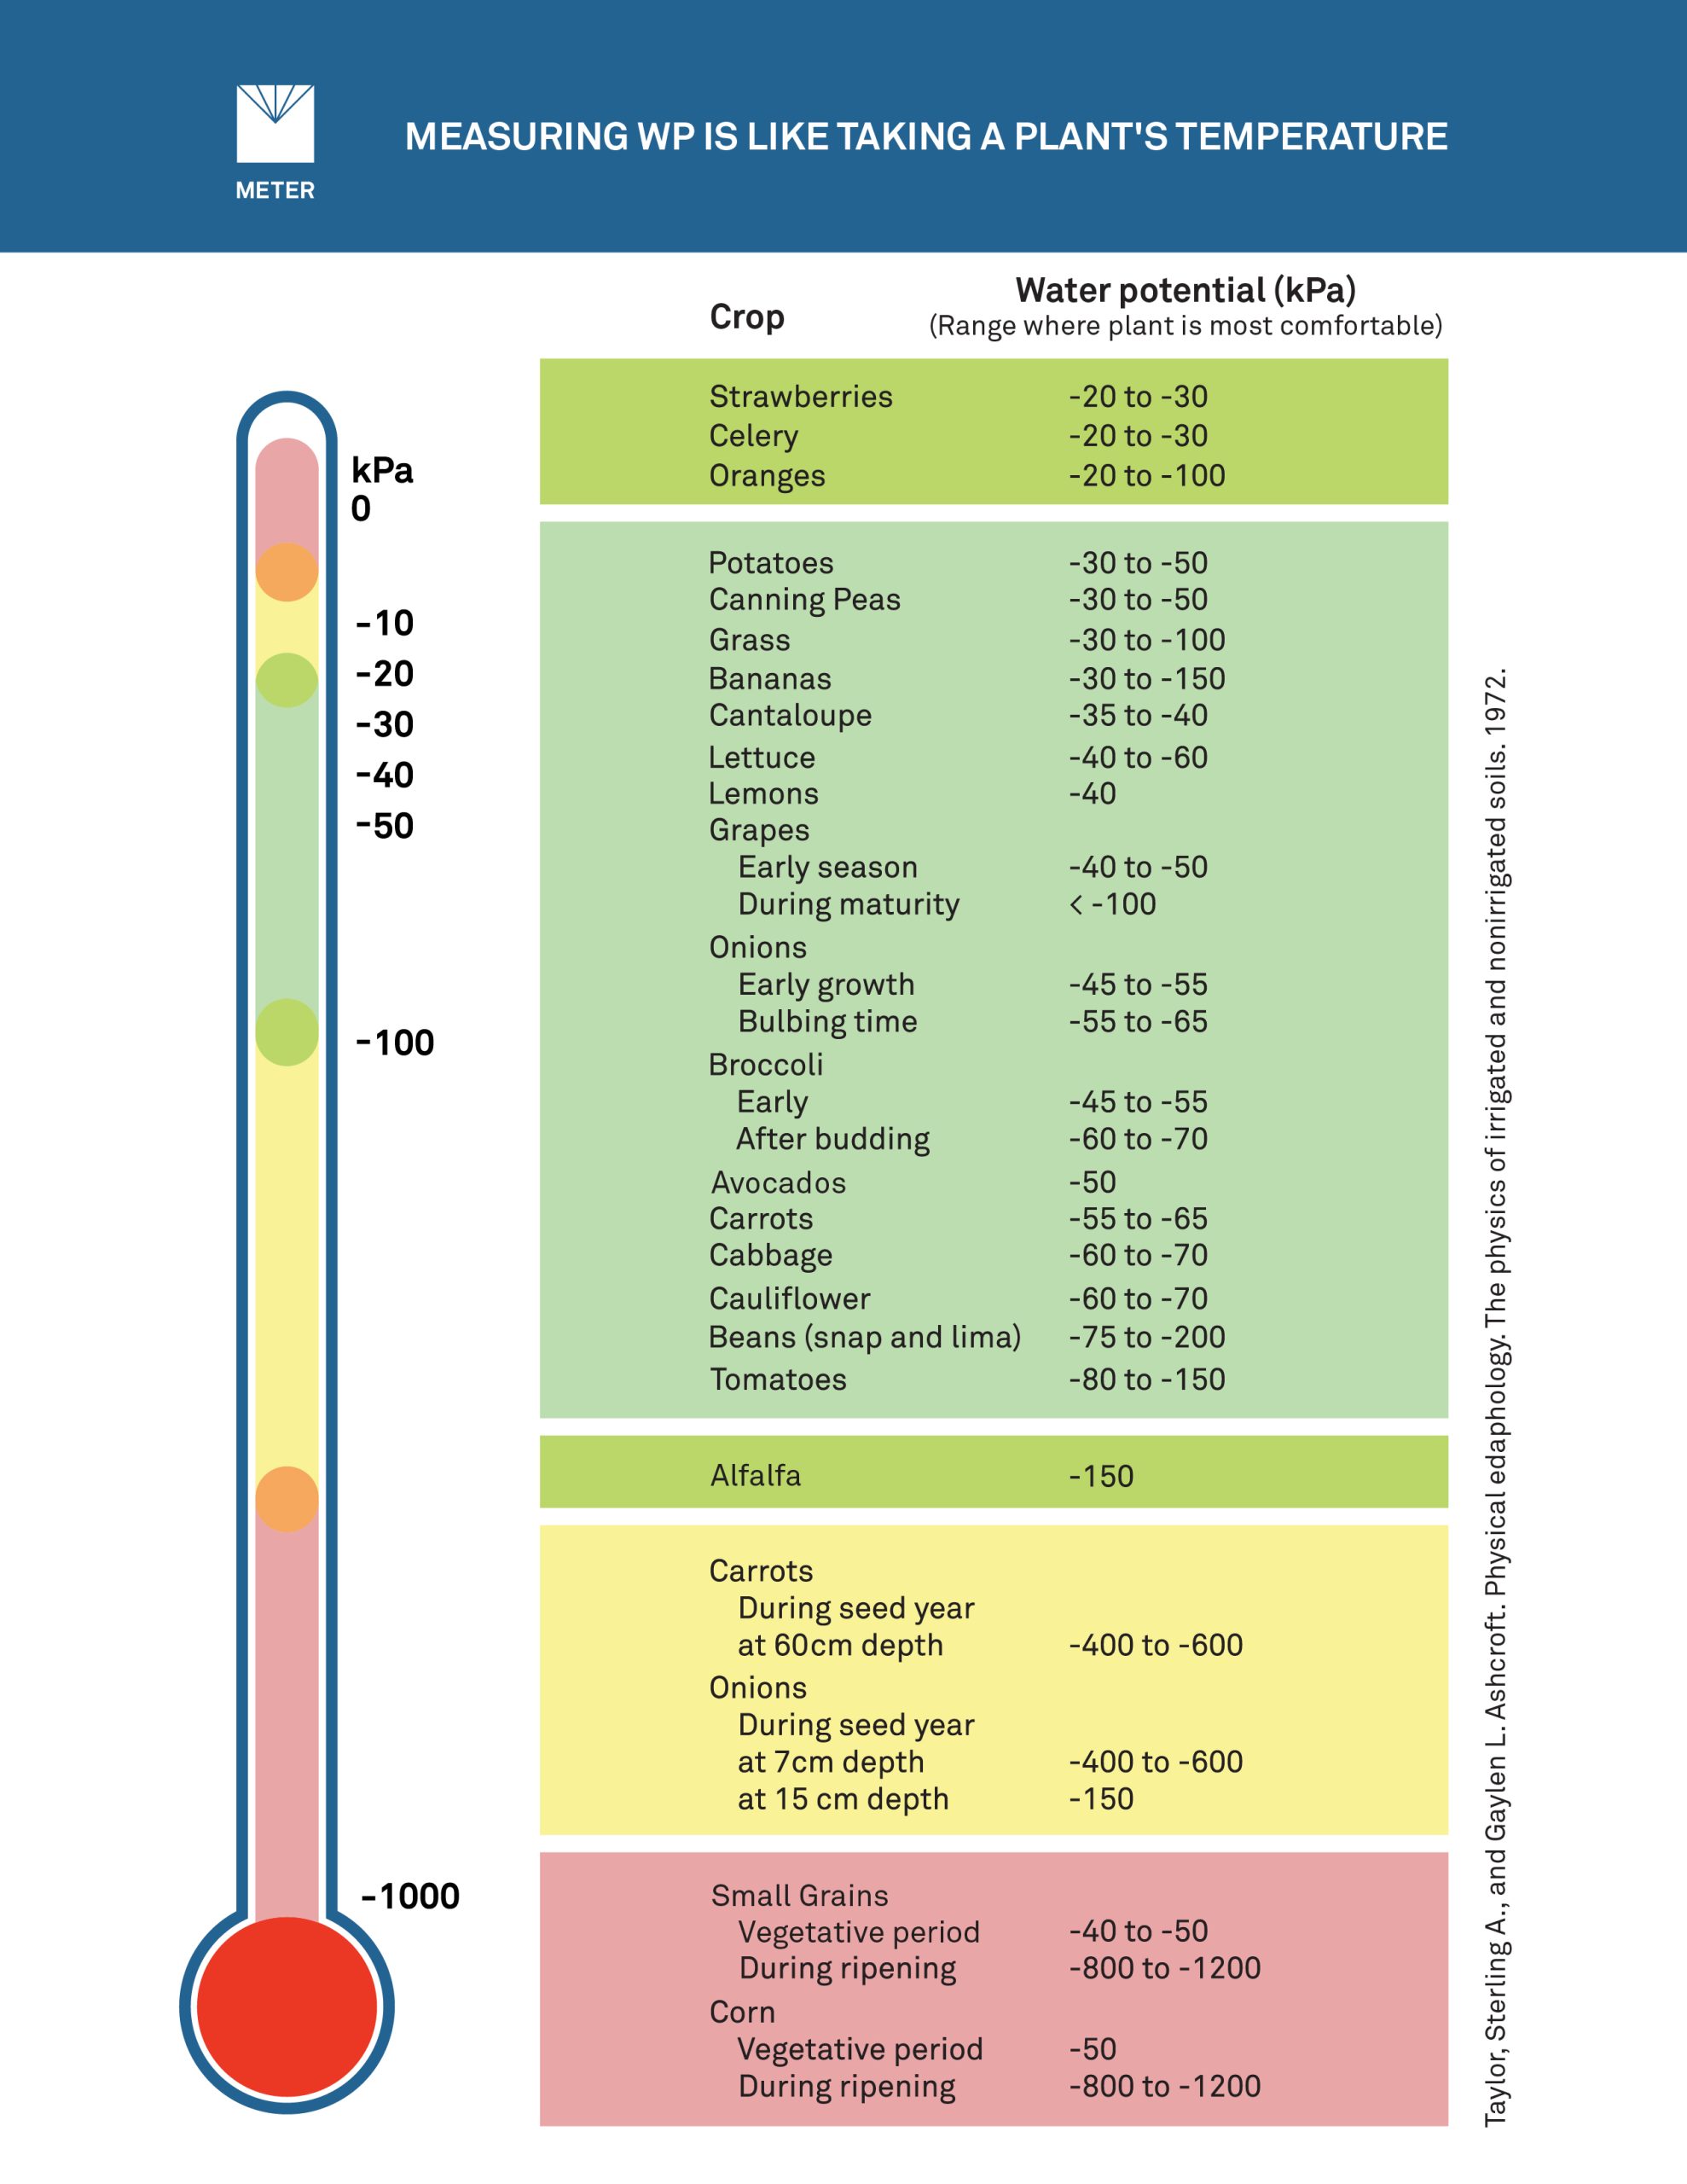
Water potential measurements clearly indicate plant available water, and unlike water content, there is an easy reference scale—plant optimal runs from about -2 to 5 kPa which is on the very wet side, to approximately -100 kPa, at the drier end of optimal. Below that, plants will be in deficit, and past -1000 kPa they start to suffer. Depending on the plant, water potentials below -1000 to -2000 kPa cause permanent wilting. Table 1 illustrates the easy reference scale for some types of crops. Plants will stay out of stress and yield more when kept within this water potential comfort range.
Though water potential is a better indicator of plant available water than water content, in most situations, it’s useful to use both water potential sensors and soil moisture sensors.
The intensity measurement of water potential doesn’t translate directly into the quantity of water stored or needed. Water content information is also required in applications such as irrigation management and water balance studies. For more information, read: “When to water–Dual measurements solve the mystery”.
In this webinar, Dr. Doug Cobos differentiates water potential from water content, discusses the theory, application, and key components of water potential, as well as the implications water potential has for researchers and irrigation management.
Water potential is the energy required, per quantity of water, to transport an infinitesimal quantity of water from the sample to a reference pool of pure free water. To understand what that means, compare the water in a soil sample to water in a drinking glass. The water in the glass is relatively free and available; the water in the soil is bound to surfaces diluted by solutes and under pressure or tension. In fact, the soil water has a different energy state from “free” water. The free water can be accessed without exerting any energy. The soil water can only be extracted by expending energy. Soil water potential expresses how much energy you would need to expend to pull that water out of the soil sample.
Soil water potential is a differential property. For the measurement to have meaning, a reference must be specified. The reference typically specified is pure, free water at the soil surface. The water potential of this reference is zero. Water potential in the environment is almost always less than zero, because you have to add energy to get the water out.
1. Water movement
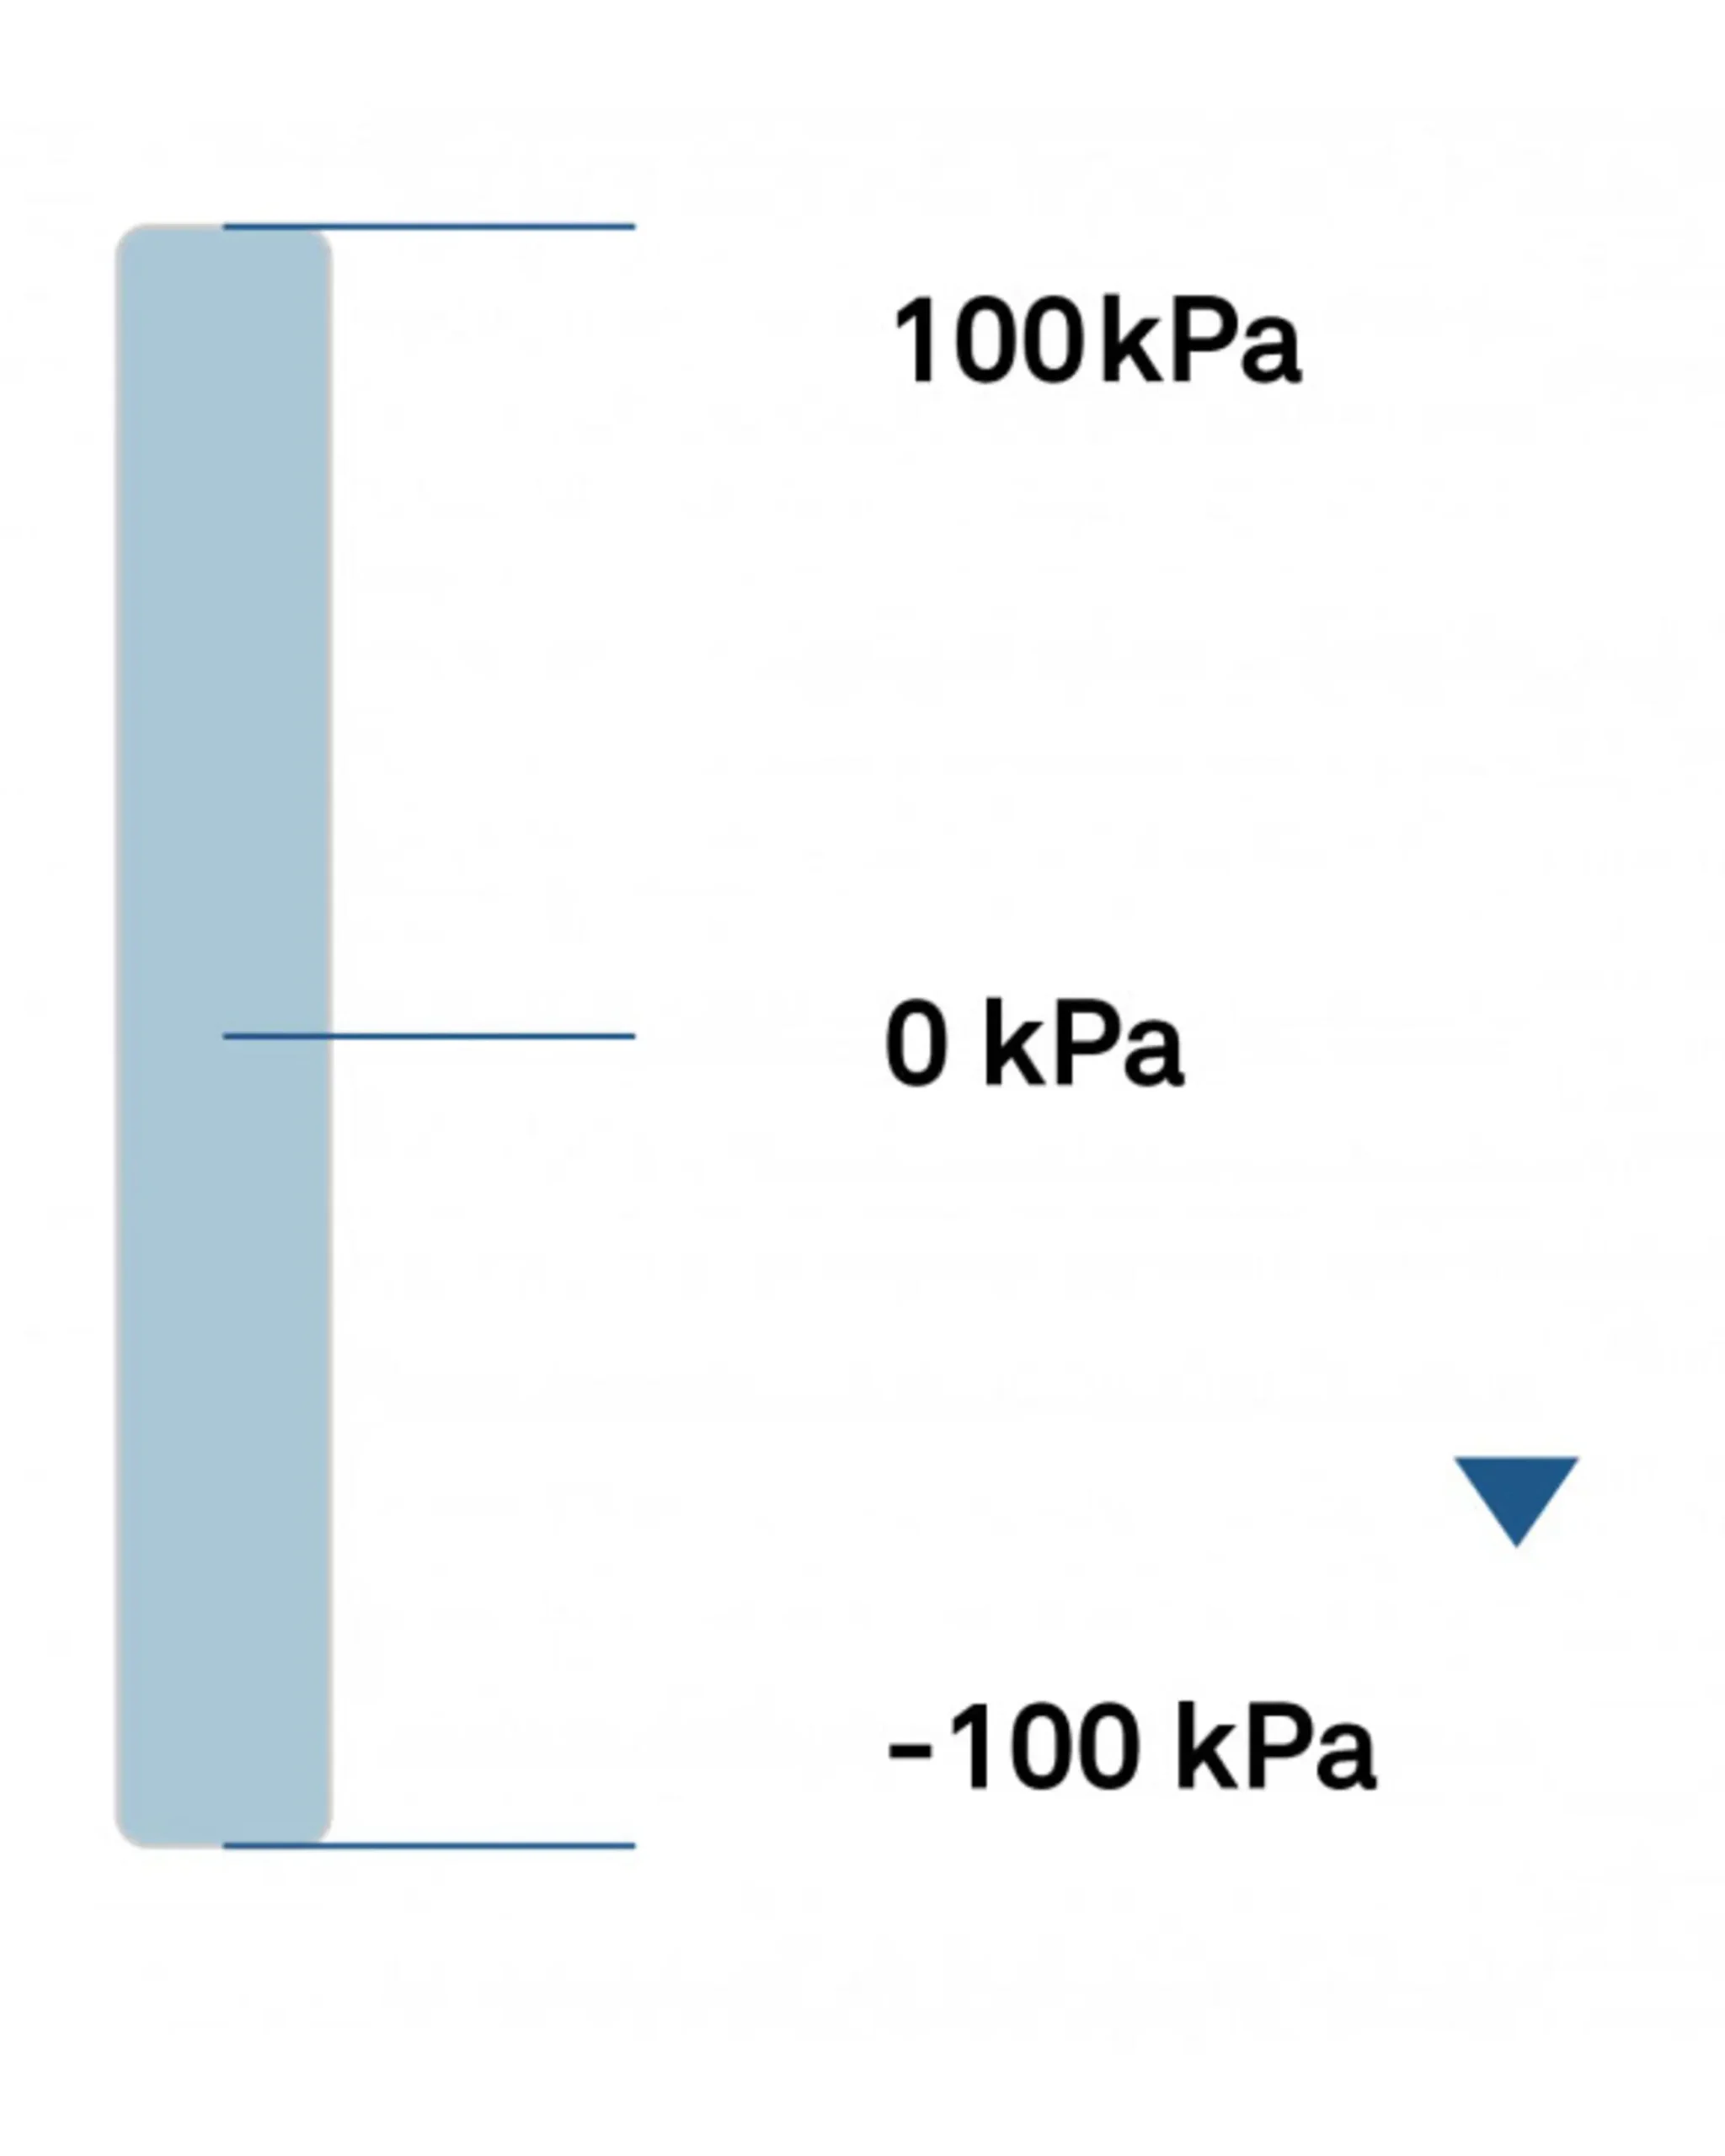
Water will always flow from high potential to low potential. This is the second law of thermodynamics—energy flows along the gradient of the intensive variable. Water will move from a higher energy location to a lower energy location until the locations reach equilibrium, as illustrated in Figure 3. For example, if a soil’s water potential were -50 kPa, water would move toward the more negative -100 kPa to become more stable.
2. Plant water availability
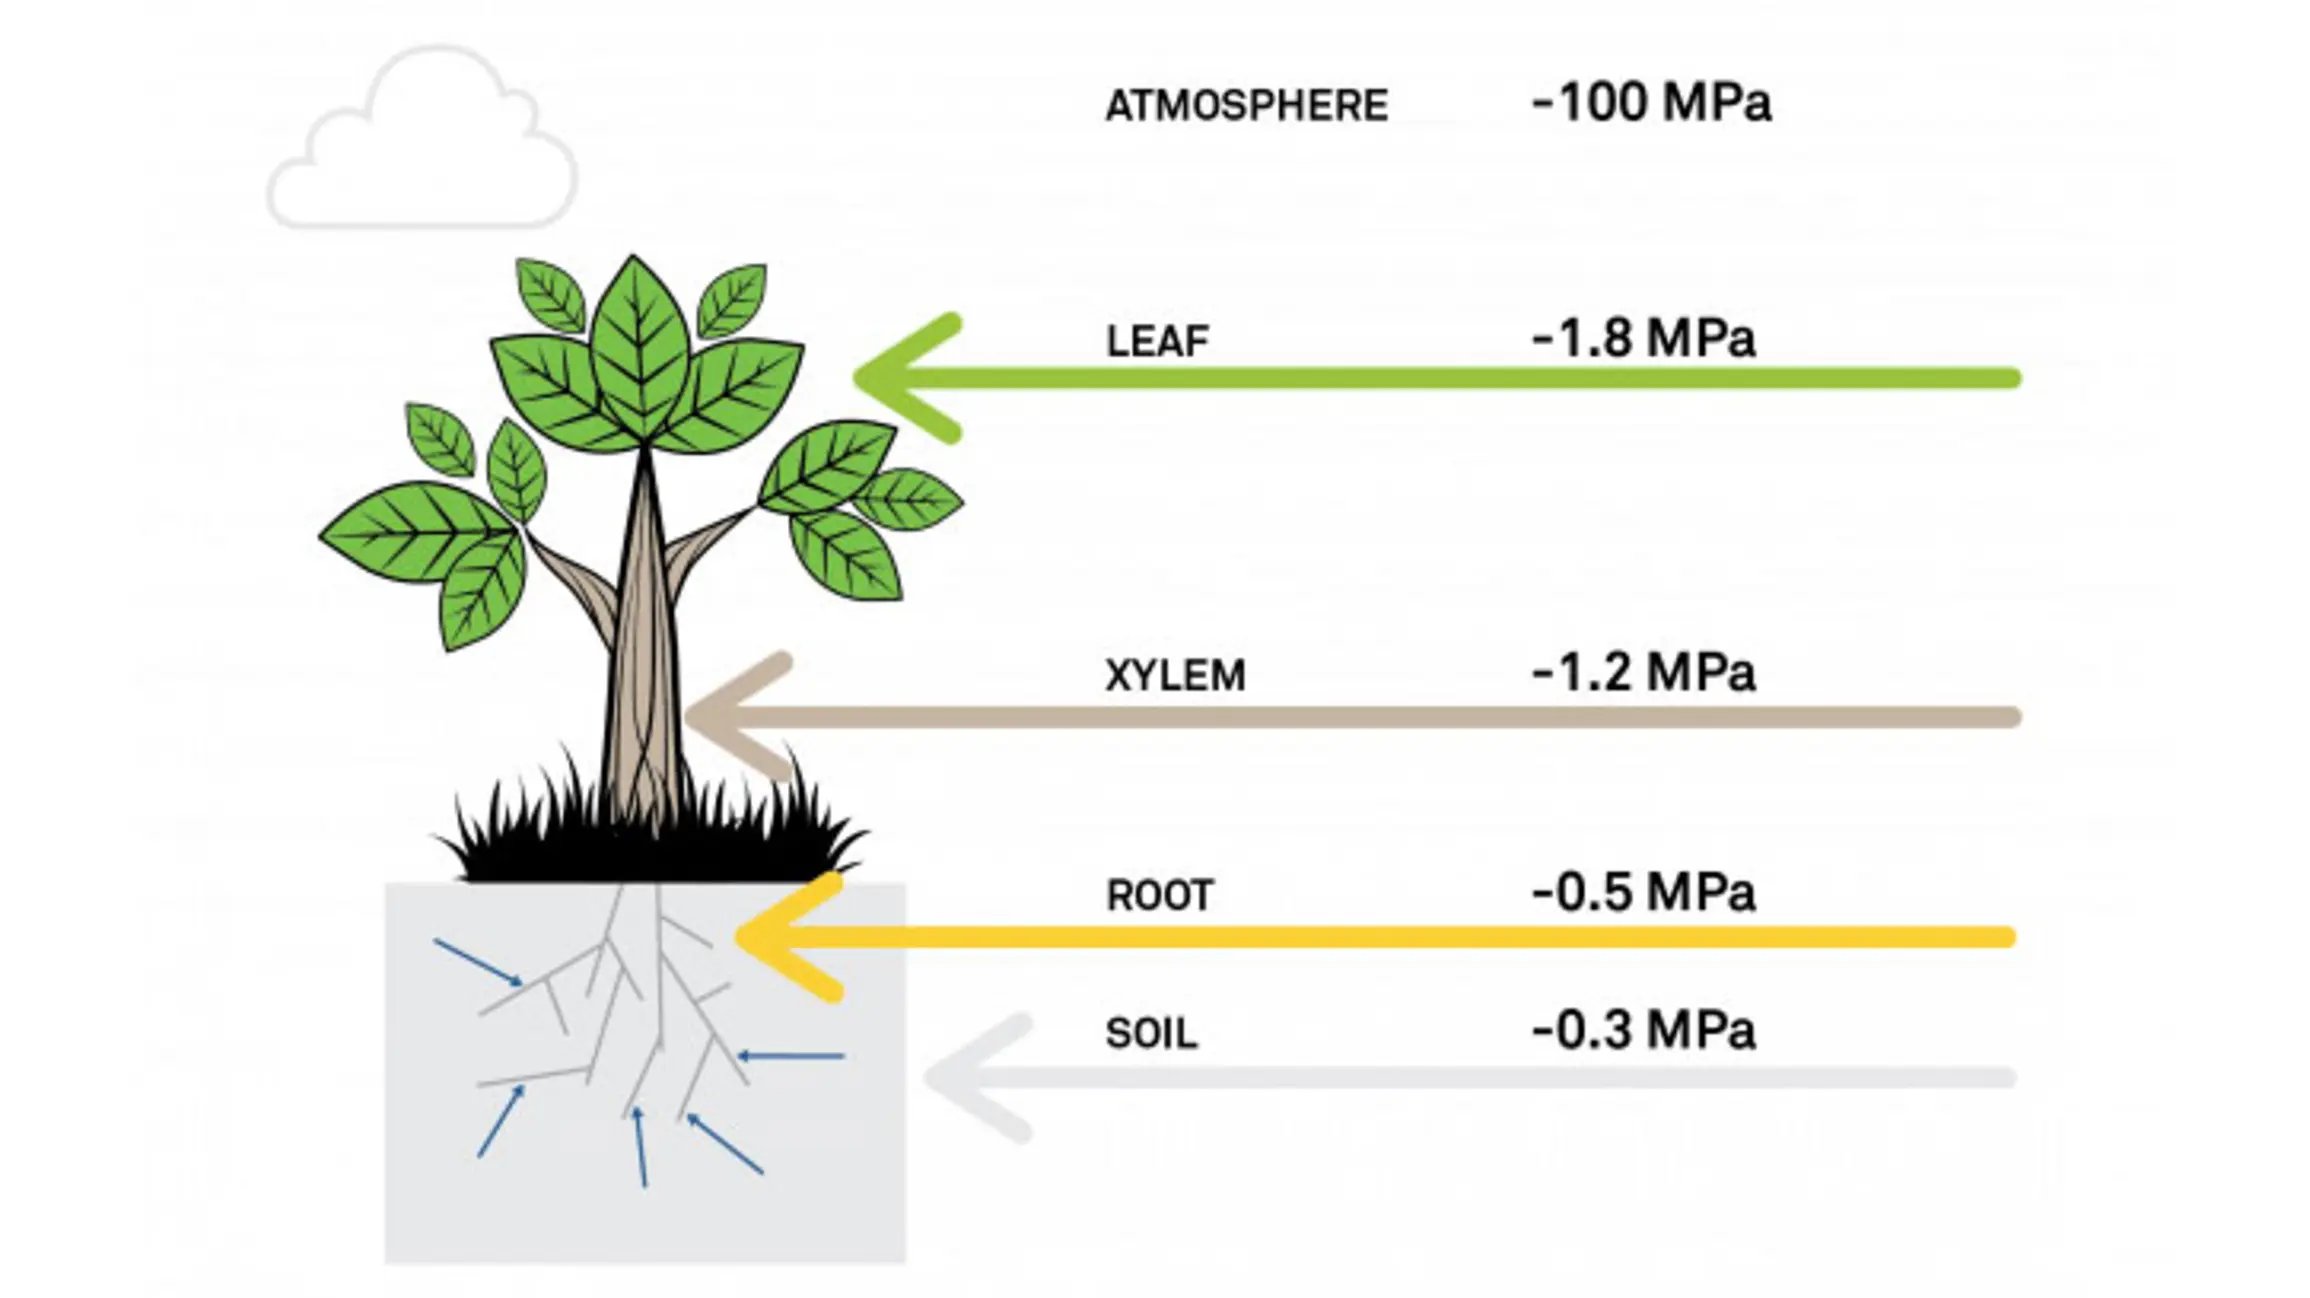
Liquid water moves from soil to and through roots, through the xylem of plants, to the leaves, and eventually evaporates in the substomatal cavities of the leaf. The driving force for this flow is a water potential gradient. Thus, in order for water to flow, the leaf water potential must be lower than the soil water potential. In Figure 4, the soil is at -0.3 MPa and the roots are slightly more negative at -0.5 MPa. This means the roots will pull water up from the soil. Then the water will move up through the xylem and out through the leaves. And the atmosphere, at -100 MPa, is what drives this gradient.
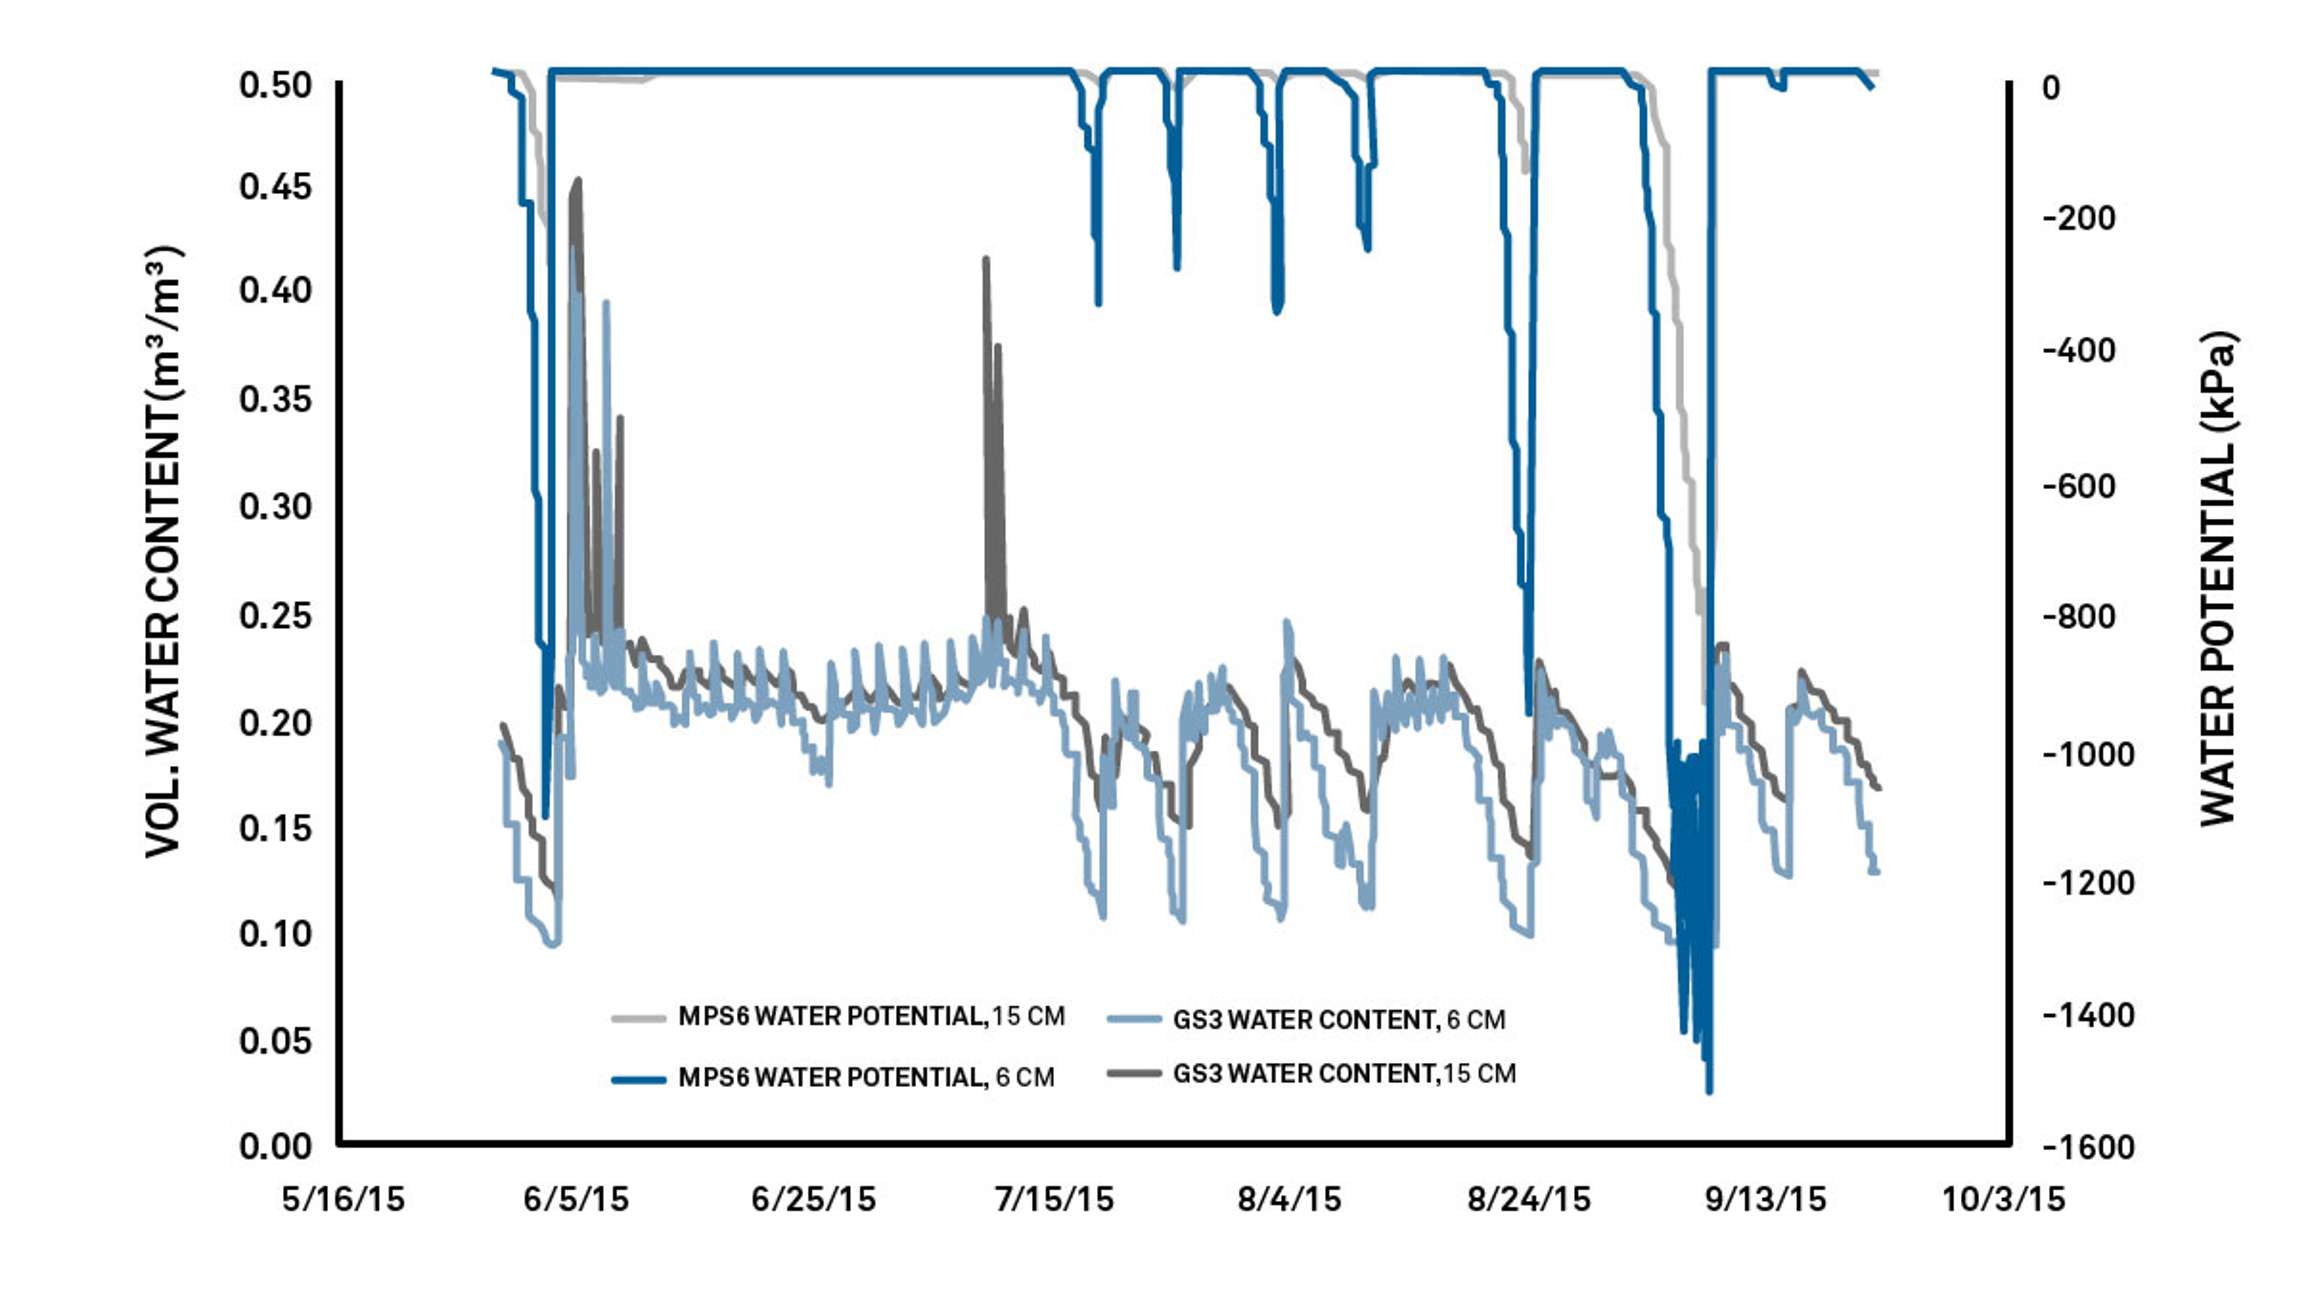
Irrigators and scientists use water potential sensors in conjunction with water content sensors to understand plant water availability. In Figure 5, you can observe where the water content declines and at what percentage the plants begin to stress. It’s also possible to recognize when the soil has too much water: the water content is above where water potential sensors start to sense plant stress. Using this information, researchers can identify the plant optimal range at 12% to 17% volumetric water content. Anything below or above that range will be too little or too much water.
To learn more about how soil water potential indicates plant water availability, read “When to water: Dual measurements solve the mystery“.
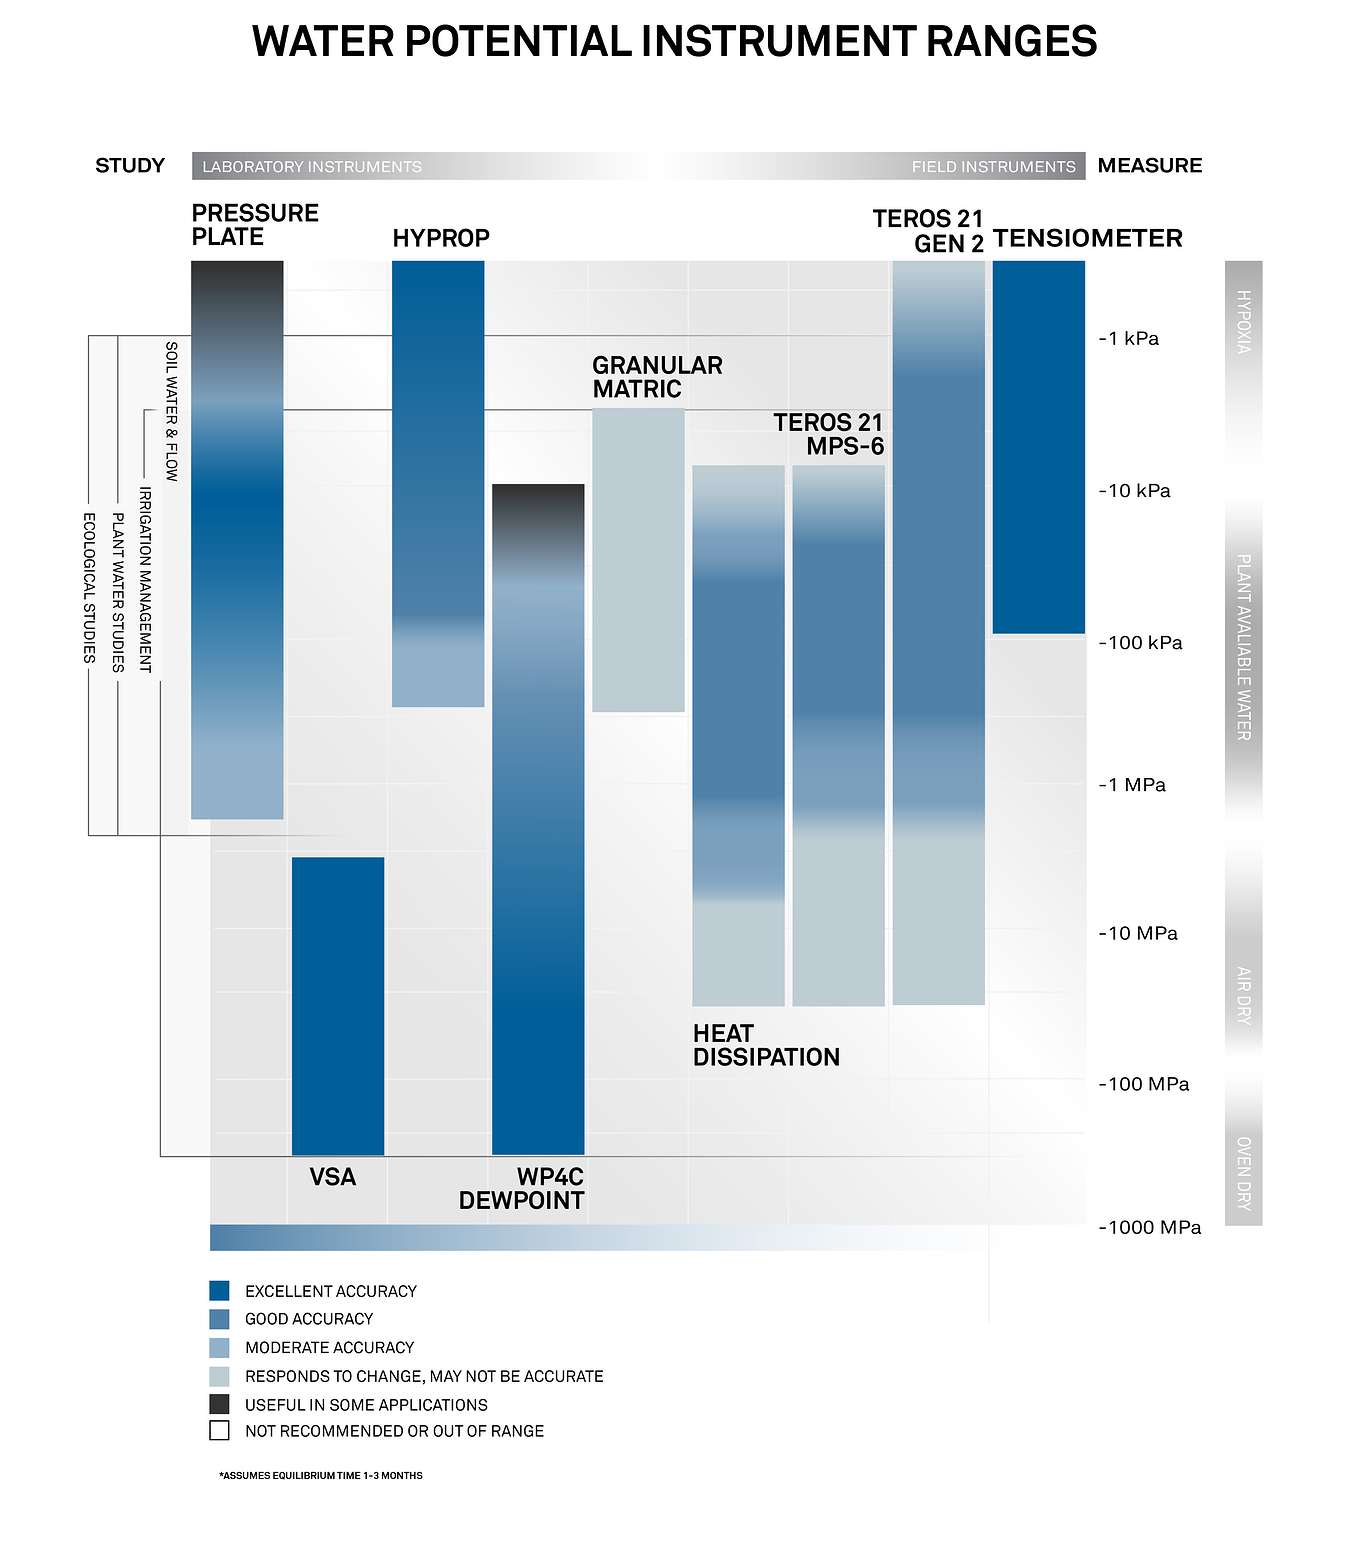
Figure 6 illustrates that there are different water potential instruments that measure different ranges. Watch the video to see how you can combine METER LABROS instruments to measure the full range of soil water potential. Learn more about how to measure water potential and which instruments are used for what purpose here.
Water potential is frequently called water tension, soil suction, and soil pore water pressure. We typically use units of pressure to describe soil water potential, including megapascals (MPa), kilopascals (kPa), bars, and meters (mH2O), centimeters (cmH2O), or millimeters of water (mmH2O).
Water potential is actually measured in energy per unit of mass, so the official units should be joules per kilogram, but if you take into account the density of water, the units become kilopascals, therefore we typically describe it using units of pressure.
The total water potential is the sum of four different components.
Soil water potential is the sum of four different components: gravitational potential + the matric potential + the pressure potential + the osmotic potential (Equation 1).

Matric potential is the most significant component as far as soil is concerned because it relates to the water that is adhering to soil surfaces. In Figure 7, the matric potential is what created the water film clinging to the soil particles. As water drains out of the soil, the air-filled pore spaces get bigger, and the water gets more tightly bound to the soil particles as the matric potential decreases.
Matric potential arises because water is attracted to most surfaces through hydrogen bonding and van der Waals forces. Soil is made up of small particles, providing lots of surfaces that will bind water. This binding is highly dependent on soil type. For example, sandy soil has large particles which provide less surface-binding sites, while a silt loam has smaller particles and more surface-binding sites.
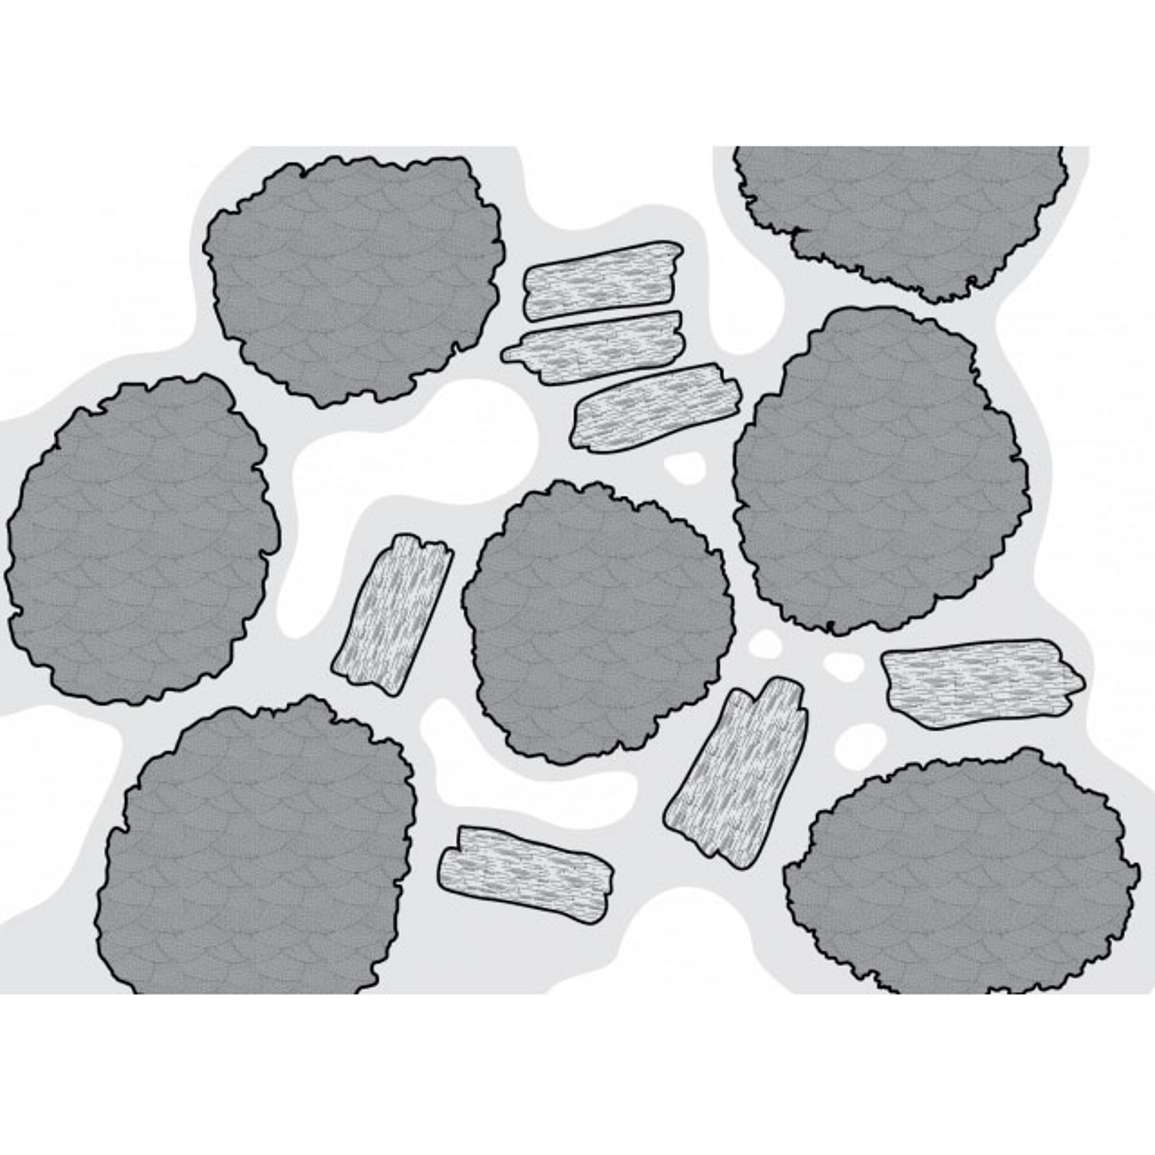
Watch the video below to visualize matric potential in action.
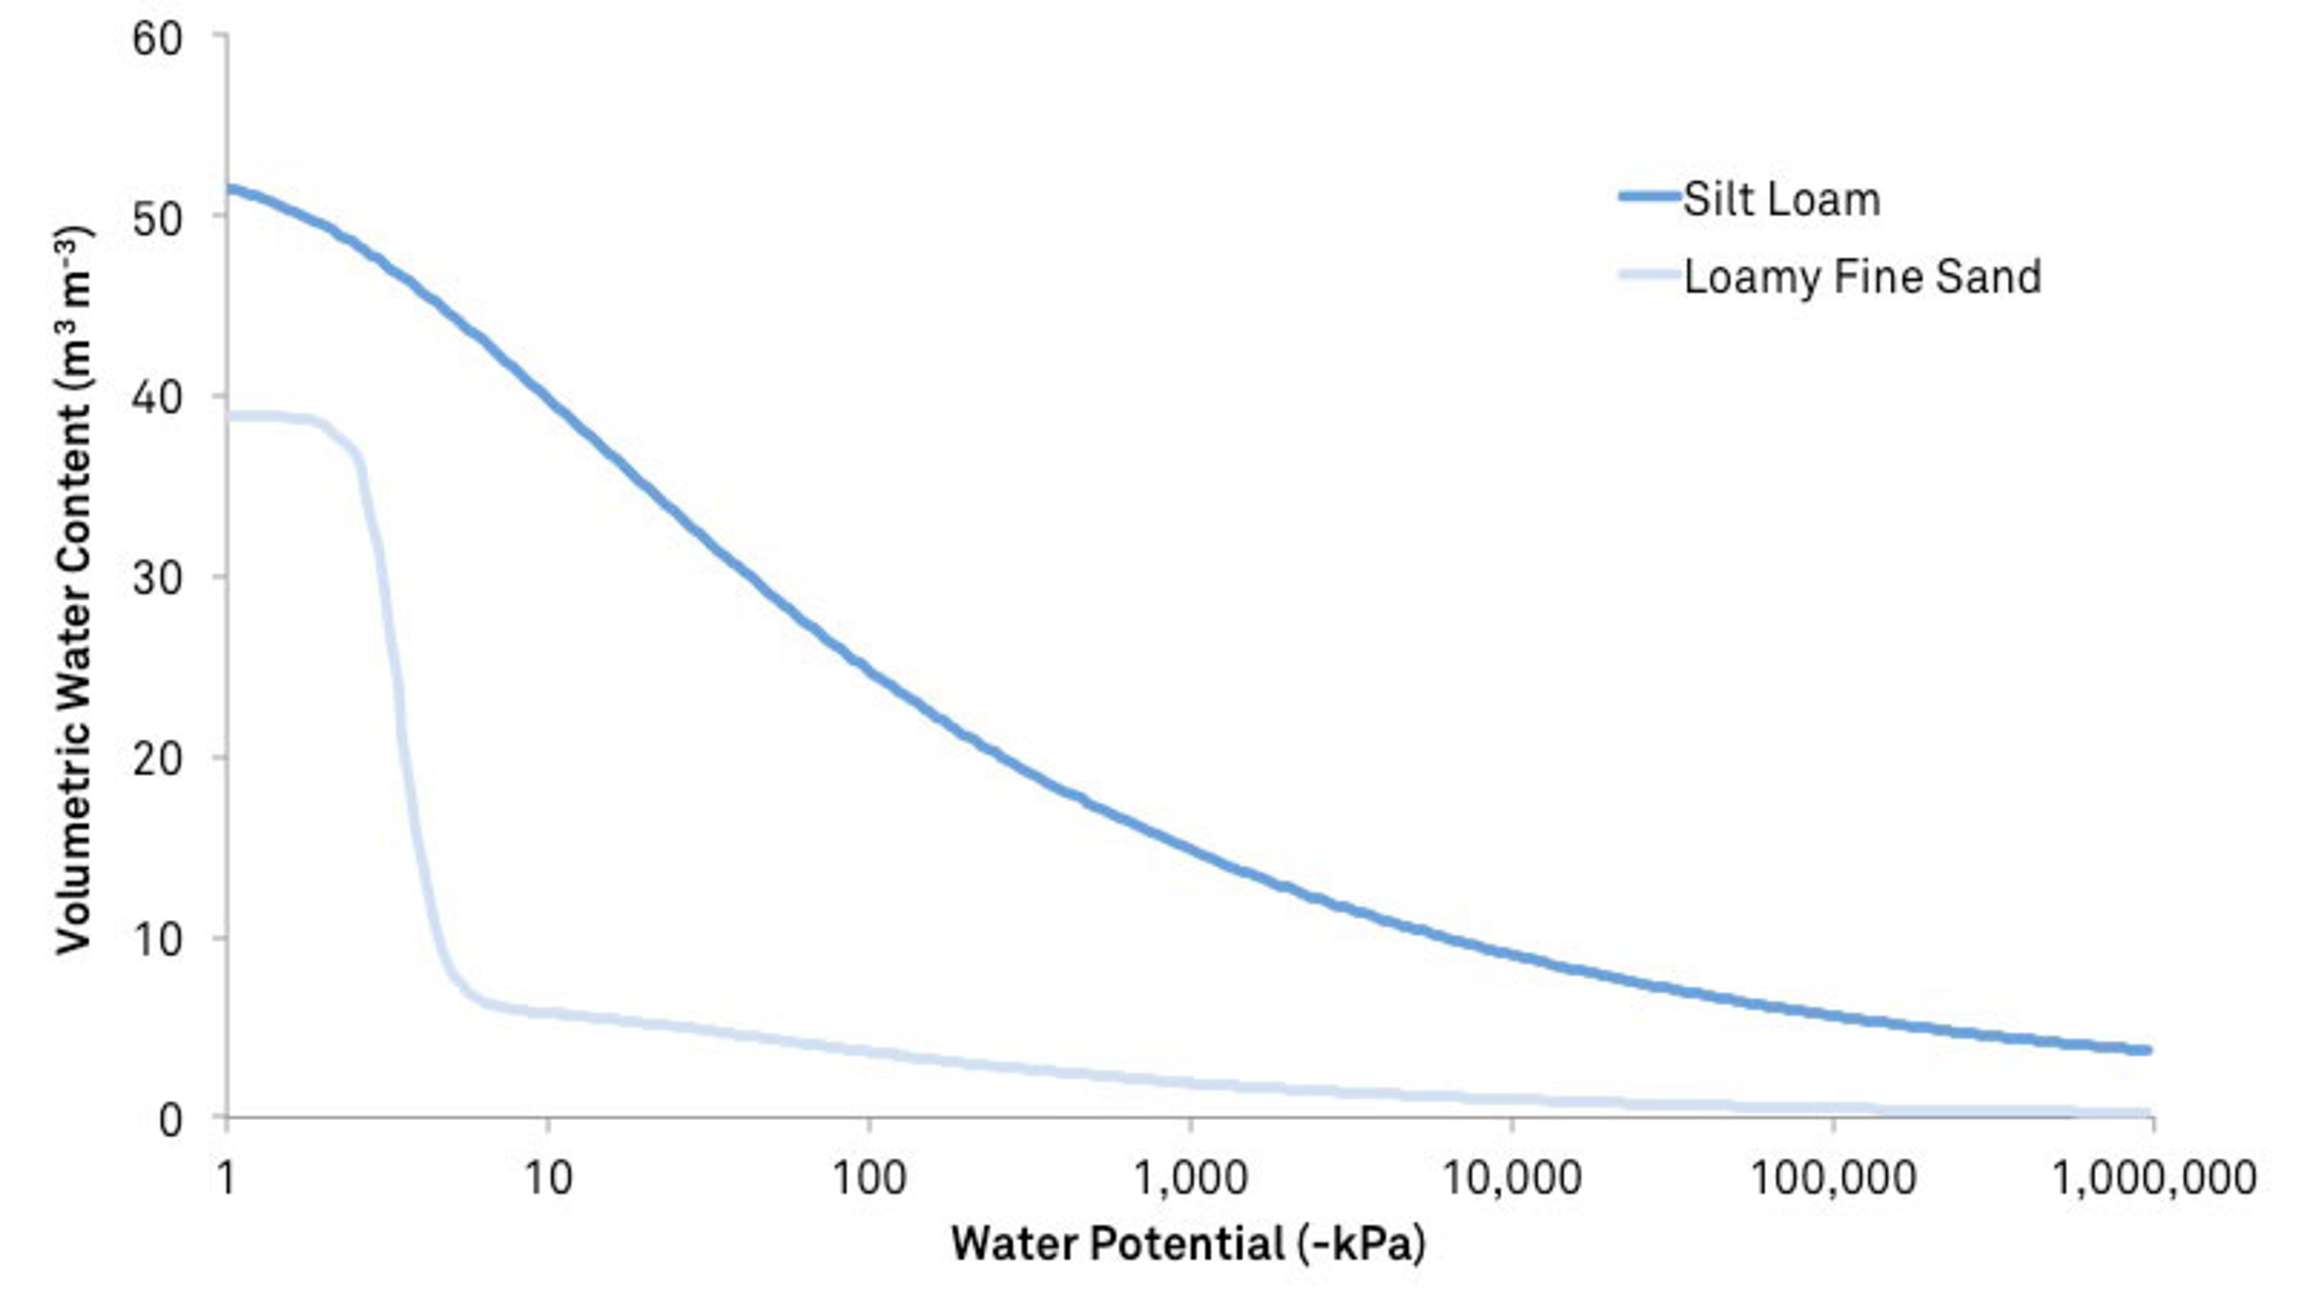
The following figure, showing moisture release curves for three different types of soil, demonstrates the effect of surface area. Sand, containing 10% water, has a high matric potential, and the water is readily available to organisms and plants. Silt loam, containing 10% water, will have a much lower matric potential, and the water will be significantly less available.
Matric potential is always negative or zero and is the most significant component of soil water potential in unsaturated conditions.
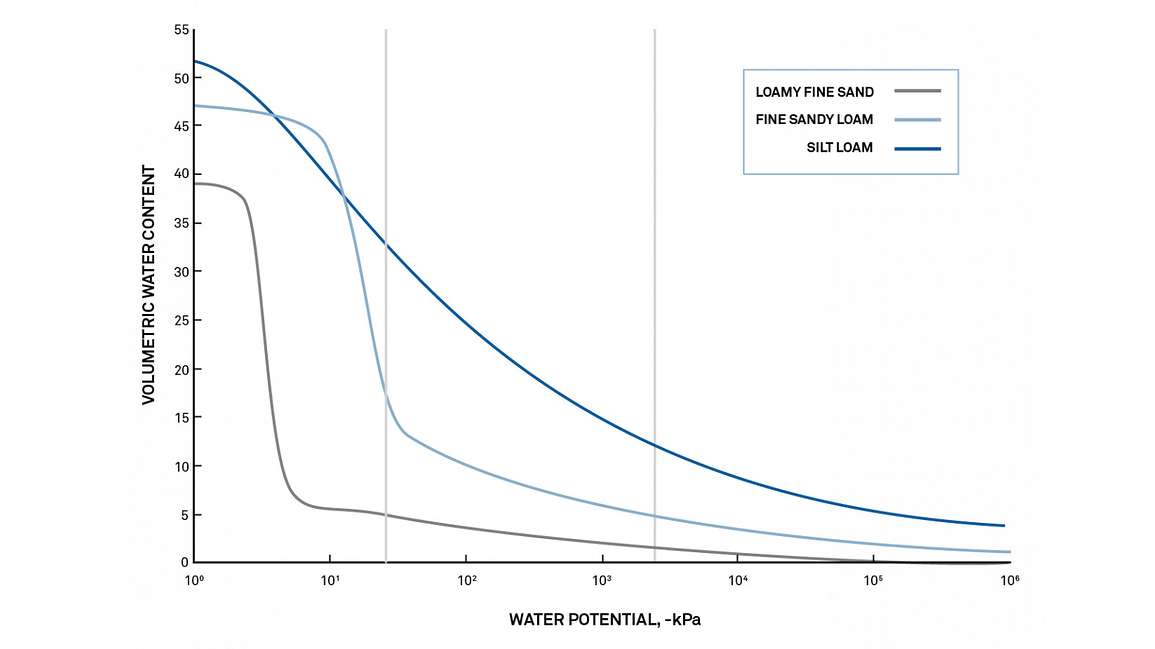
Learn more about moisture release curves and the relationship between soil water potential and soil water content here.
Tensiometers and the TEROS 21 are both soil water potential sensors that measure matric potential in the field. To find out which field water potential sensor is right for your application, read “Which soil sensor is perfect for you?”
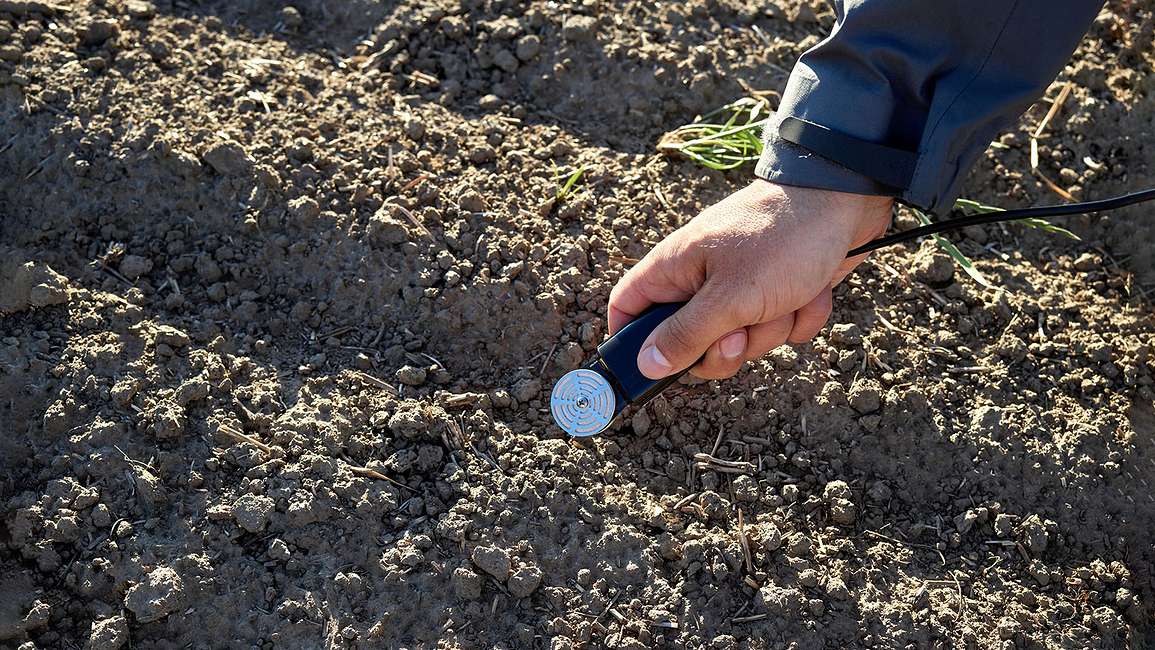
Osmotic potential describes the dilution and binding of water by solutes that are dissolved in the water. This potential is also always negative.
Osmotic potential only affects the system if there is a semi-permeable barrier that blocks the passage of solutes. This is actually quite common in nature. For example, plant roots allow water to pass but block most solutes. Cell membranes also form a semi-permeable barrier. A less-obvious example is the air-water interface, where water can pass into air in the vapor phase but salts are left behind.
You can calculate osmotic potential from the following equation if you know the concentration of solute in the water

Where C is the concentration of solute (mol/kg), ɸ is the osmotic coefficient (-0.9 to 1 for most solutes), v is the number of ions per mol (NaCl= 2, CaCl2 = 3, sucrose = 1), R is the gas constant, and T is the Kelvin temperature.
Osmotic potential is always negative or zero and is significant in plants and some salt-affected soils.
Gravitational potential arises because of water’s location in a gravitational field. It can be positive or negative, depending on where you are in relation to the specified reference of pure, free water at the soil surface. Gravitational potential is then

Where G is the gravitational constant (9.8 m s-2) and H is the vertical distance from the reference height to the soil surface (the specified height).
Pressure potential is a hydrostatic or pneumatic pressure being applied to or pulled on the water. It is a more macroscopic effect acting throughout a larger region of the system.
There are several examples of positive pressure potential in the natural environment. For example, there is a positive pressure present below the surface of any groundwater. You can feel this pressure yourself as you swim down into a lake or pool. Similarly, a pressure head or positive pressure potential develops as you move below the water table. Turgor pressure in plants and blood pressure in animals are two more examples of positive pressure potential.
Pressure potential can be calculated from

Where P is the pressure (Pa) and PW is the density of water.
Though pressure potential is usually positive, there are important cases where it is not. One is found in plants, where a negative pressure potential in the xylem draws water from the soil up through the roots and into the leaves.
Water potential and relative humidity are related by the Kelvin equation. If you know temperature and humidity, you can calculate the water potential using this equation

Where Ψ is water potential (MPa), HR is the relative humidity (unitless), R is the universal gas constant (8.3143 J mol-1 K -1), MW is the mass of water (18.02 g/mol), and T is Kelvin temperature.
Water potential:
Key points:
Find more answers to the question ‘what is water potential’ here: Return to main water potential page or Talk to an expert about using water potential in your application.
Kirkham, Mary Beth. Principles of soil and plant water relations. Academic Press, 2014. Book link
Taylor, Sterling A., and Gaylen L. Ashcroft. Physical edaphology. The physics of irrigated and nonirrigated soils. 1972. Book link
Hillel, Daniel. Fundamentals of soil physics. Academic press, 2013. Book link
Dane, Jacob H., G. C. Topp, and Gaylon S. Campbell. Methods of soil analysis physical methods. No. 631.41 S63/4. 2002.
Dr. Colin Campbell’s webinar “Water Potential 201: Choosing the Right Instrument” covers water potential instrument theory, including the challenges of measuring water potential and how to choose and use various water potential instruments.
Essentially, there are only two primary measurement methods for water potential—tensiometers and vapor pressure methods. Tensiometers work in the wet range—special tensiometers that retard the boiling point of water have a range from 0 to about -0.2 MPa. Vapor pressure methods work in the dry range—from about -0.1 MPa to -300 MPa (0.1 MPa is 99.93% RH; -300 MPa is 11%).
Historically, these ranges did not overlap, but recent advances in tensiometer and temperature-sensing technology have changed that. Now, a skilled user with excellent methods and the best equipment can measure the full water potential range in the lab.
There are reasons to look at secondary measurement methods, though. Vapor pressure methods are not useful in situ, and the accuracy of the tensiometer must be paid for with constant, careful maintenance (although a self-filling version of the tensiometer is available).
Additionally, there are traditional methods like gypsum blocks, pressure plates, and filter paper that should be understood. This section briefly covers the strengths and limitations of each method.
The pressure plate was introduced in the 1930s by L.A. Richards. It doesn’t actually measure the water potential of a sample. Instead, it brings the sample to a specific water potential by applying pressure to the sample and allowing the excess water to flow out through a porous ceramic plate. When the sample comes to equilibrium, its water potential will be equivalent to the pressure applied.
Pressure plates are typically used to make soil moisture characteristic curves. Once the soil samples reach a specific water potential under pressure, the researcher can remove the sample from the plate and dry it to measure its water content. A soil moisture characteristic can be produced by making these measurements at different pressures in the pressure plate apparatus.
The accuracy of pressure plates is important, because they are often used to calibrate other secondary measurement methods.
In order to make an accurate moisture release curve with a pressure plate, you have to ensure that the sample has fully come to equilibrium at the designated pressure. Several reviewers, including Gee et. al (2002), Cresswell et. al (2008), and Bittelli and Flury (2009) have noted problems with this assumption.
Errors, particularly at low water potentials, may be caused by clogged pores in the ceramic of the pressure plate, flow restriction within the sample, loss of hydraulic contact between the plate and the soil due to soil shrinkage, and re-uptake of water when the pressure on the plate is released. At low water potentials, low hydraulic conductivities can cause equilibrium to take weeks or even months. Gee et. al (2002) measured the water potentials of samples equilibrated for 9 days on 15 bar pressure plates and found them to be at -0.5 MPa instead of the expected -1.5 MPa. Especially when constructing a moisture release curve to estimate hydraulic conductivity and determine plant available water, pressure plate measurements at potentials less than -0.1 MPa (-1 bar) can cause significant error (Bittelli and Flury, 2009).
Additionally, Baker and Frydman (2009) establish theoretically that the soil matrix would drain differently under a positive pressure than it does under suction. They postulate that equilibrium water contents achieved using suction will be significantly different than those that occur under natural conditions. Anecdotal evidence seems to support this idea, though further testing is needed. Ultimately, pressure plates may have enough accuracy in the wet range (0 to -0.5 MPa) for some applications, but other methods can provide better accuracy, which may be especially important when using the data for modeling or calibration.
The WP4C Dew Point Hygrometer is one of the few commercially available instruments that currently uses this technique. Like traditional thermocouple psychrometers, the dew point hygrometer equilibrates a sample in a sealed chamber.
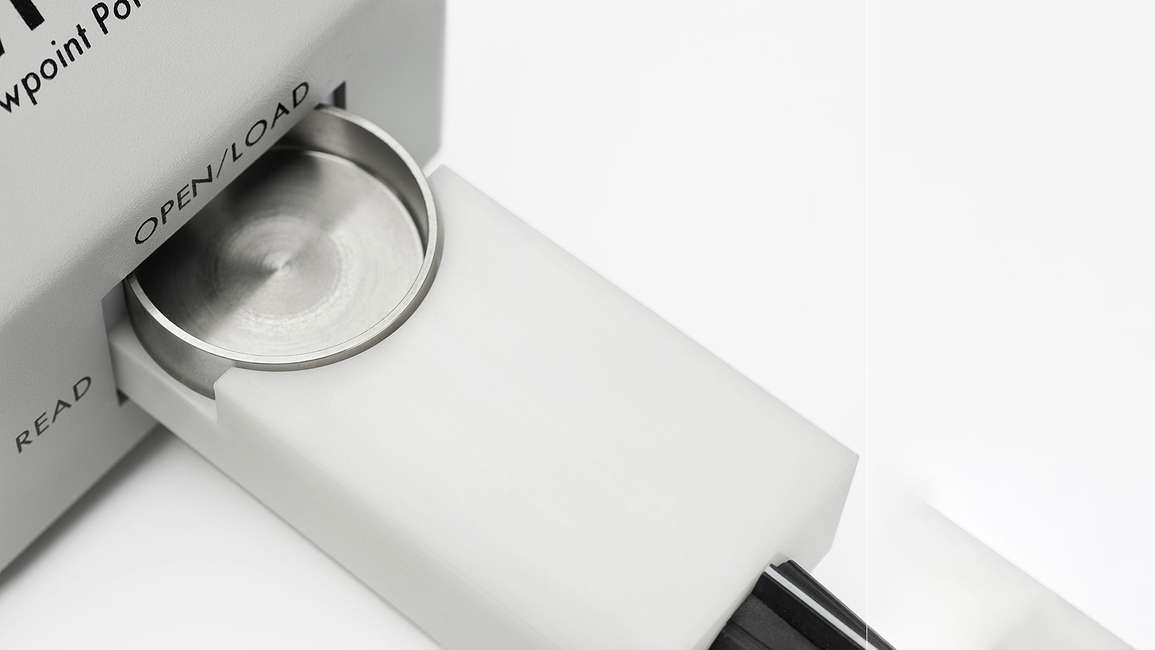
A small mirror in the chamber is chilled until dew just starts to form on it. At the dew point, the WP4C measures both mirror and sample temperatures with 0.001◦C accuracy to determine the relative humidity of the vapor above the sample.
Advantages
The most current version of this dew point hygrometer has an accuracy of ±1% from -5 to -300 MPa and is also relatively easy to use. Many sample types can be analyzed in five to ten minutes, although wet samples take longer.
Limitations
At high water potentials, the temperature differences between saturated vapor pressure and the vapor pressure inside the sample chamber become vanishingly small.
Limitations to the resolution of the temperature measurement mean that vapor pressure methods will probably never supplant tensiometers.
The dew point hygrometer has a range of -0.1 to -300 MPa, though readings can be made beyond -0.1 MPa using special techniques. Tensiometers remain the best option for readings in the 0 to -0.1 MPa range.
The HYPROP is a unique lab instrument that uses the Wind/Schindler evaporation method to make moisture release curves on soils with water potentials in the tensiometer range.
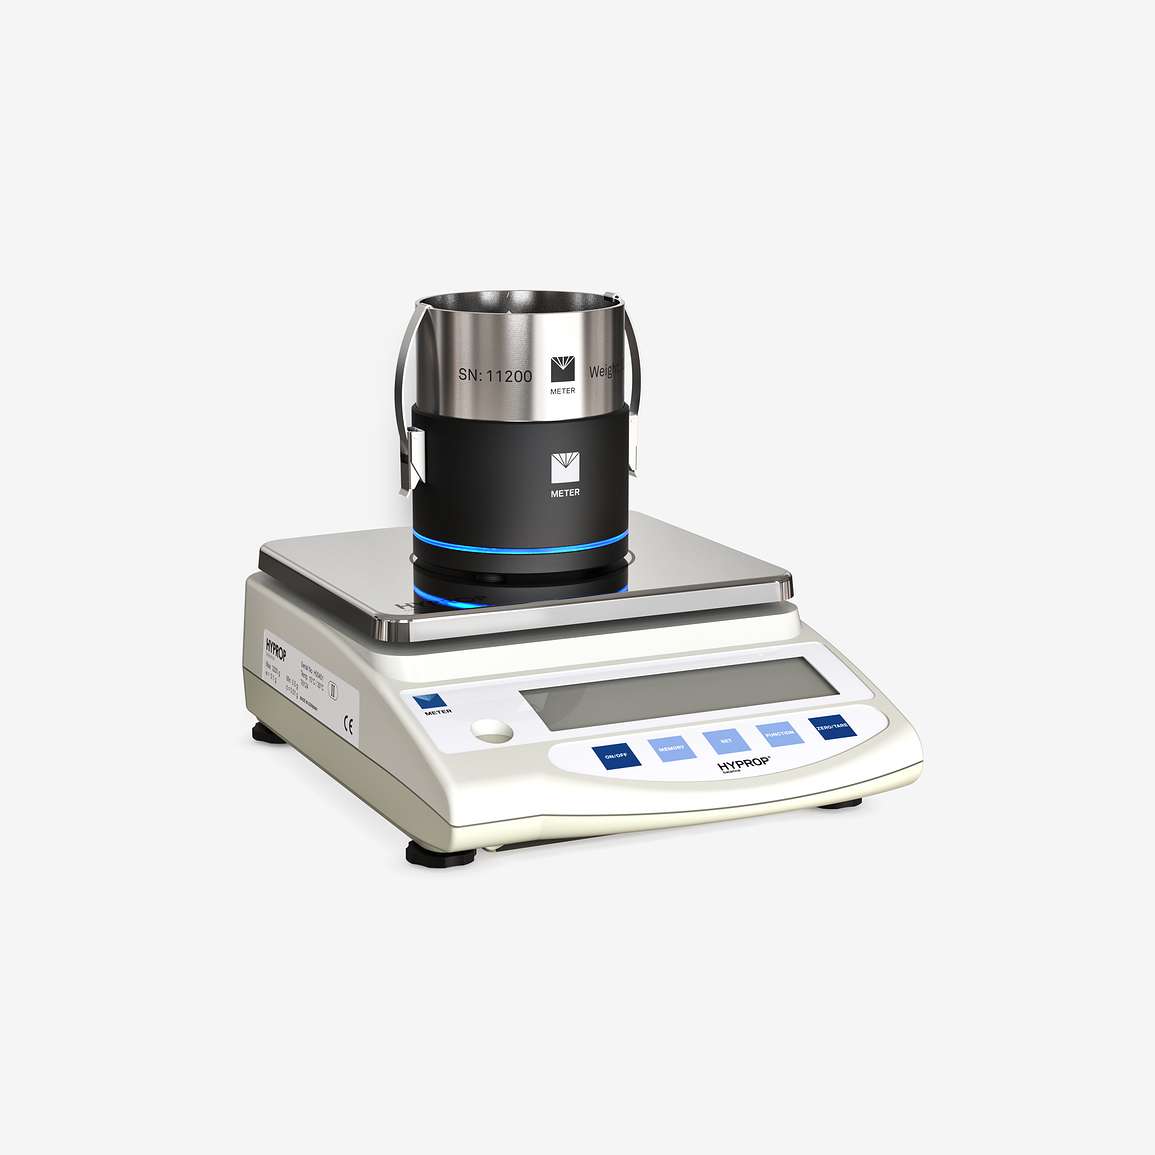
Hyprop uses two precision mini-tensiometers to measure water potential at different levels within a saturated 250 cm3 soil sample while the sample rests on a laboratory balance. Over time, the sample dries, and the instrument measures the changing water potential and the changing sample weight simultaneously. It calculates the moisture content from the weight measurements and plots changes in water potential correlated to changes in moisture content.
Results are verified, and values for dry range and saturation are calculated according to a selected model (i.e., van Genuchten/Mualem, bimodal van Genuchten/Mualem, or Brooks and Corey).
Advantages
Hyprop has high accuracy and produces a complete moisture release curve in the wet range. The curve takes three to five days to complete, but the instrument operates unattended.
Limitations
Hyprop’s range is limited by the range of tensiometers, although the mini-tensiometers have been used to measure beyond -250 kPa (-0.25 MPa) because of their boiling retardation feature.
Below -250 kPa the tensiometers cavitate. Power users have the option of adding a final point to the curve at the air-entry point for the ceramic tensiometer cup (-880 kPa; -0.88 MPa).
Water potential, by definition, is a measure of the difference in potential energy between the water in a sample and the water in a reference pool of pure, free water. The tensiometer is an actualization of this definition.
The tensiometer tube contains a pool of (theoretically) pure, free water. This reservoir is connected (through a permeable membrane) to a soil sample. Thanks to the second law of thermodynamics, water moves from the reservoir to the soil until its energy is equal on both sides of the membrane. That creates a vacuum in the tube. The tensiometer uses a negative pressure gauge (a vacuometer) to measures the strength of that vacuum and describes water potential in terms of pressure.
Advantages
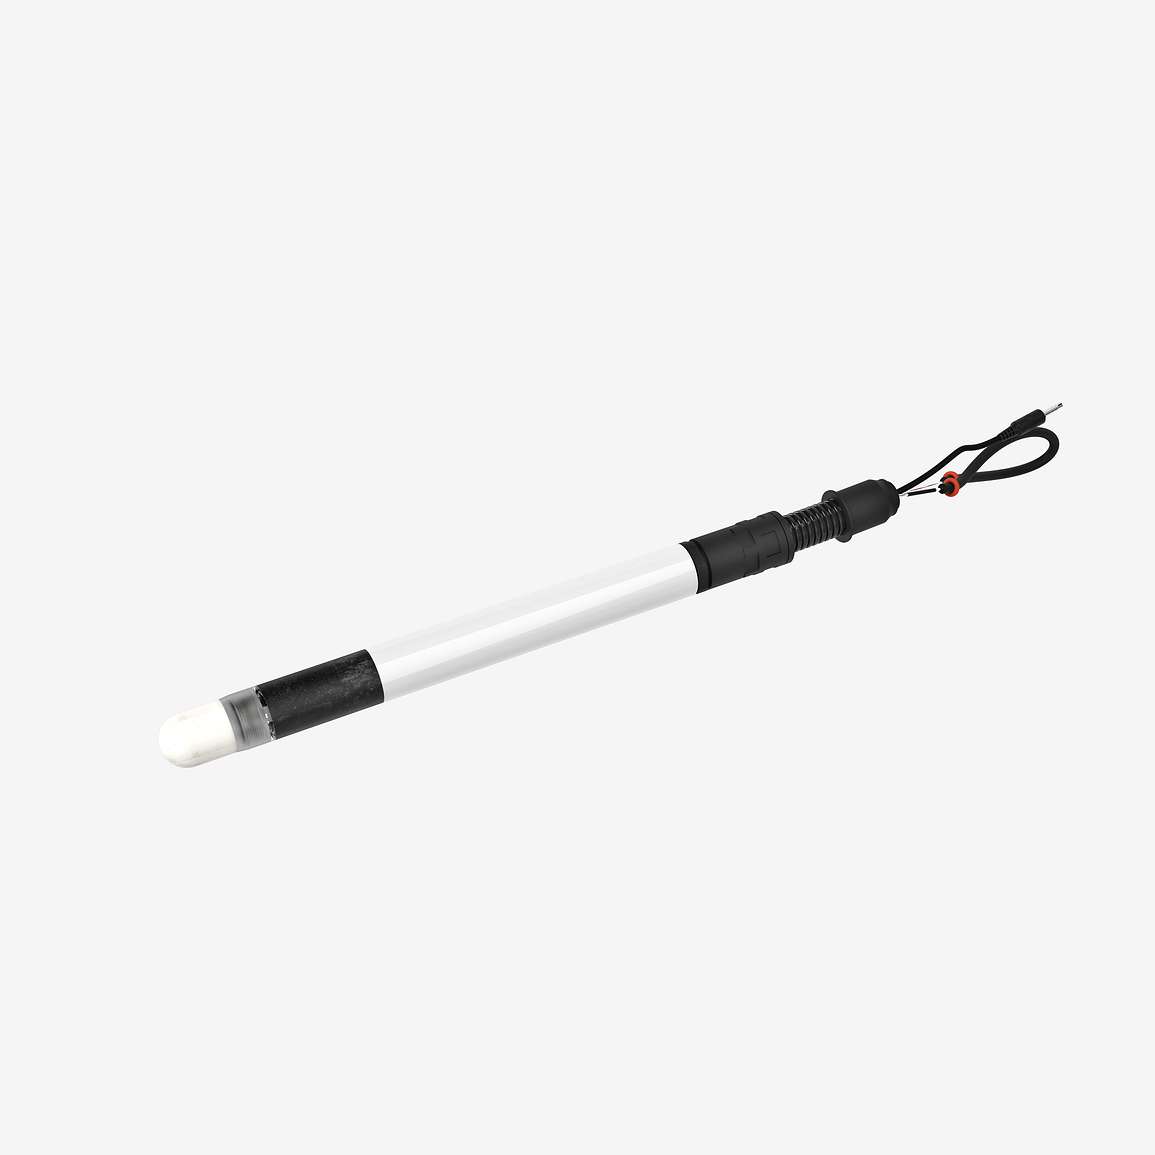
Tensiometers are probably the oldest type of water potential instrument (the initial concept dates at least to Livingston in 1908), but they can still be quite useful. In fact, in the wet range, a high-quality tensiometer, used skillfully, can have excellent accuracy.
Limitations
The tensiometer’s range is limited by the ability of water inside the tube to withstand a vacuum. Although water is essentially incompressible, discontinuities in the water surface such as edges or grit provide nucleation points where water’s strong bonds are disrupted and cavitation (low-pressure boiling) occurs. Most tensiometers cavitate around -80 kPa, right in the middle of the plant-available range.
However, METER Group Ag, in Germany, builds tensiometers that are modern classics thanks to precision German engineering, meticulous construction, and fanatical attention to detail. These tensiometers have terrific accuracy and a range that (with a careful operator) can extend to -250 kPa.
Water content tends to be easier to measure than water potential, and since the two values are related, it’s possible to use a water content measurement to find water potential.
A graph showing how water potential changes as water is adsorbed into and desorbed from a specific soil matrix is called a moisture characteristic or a moisture release curve.
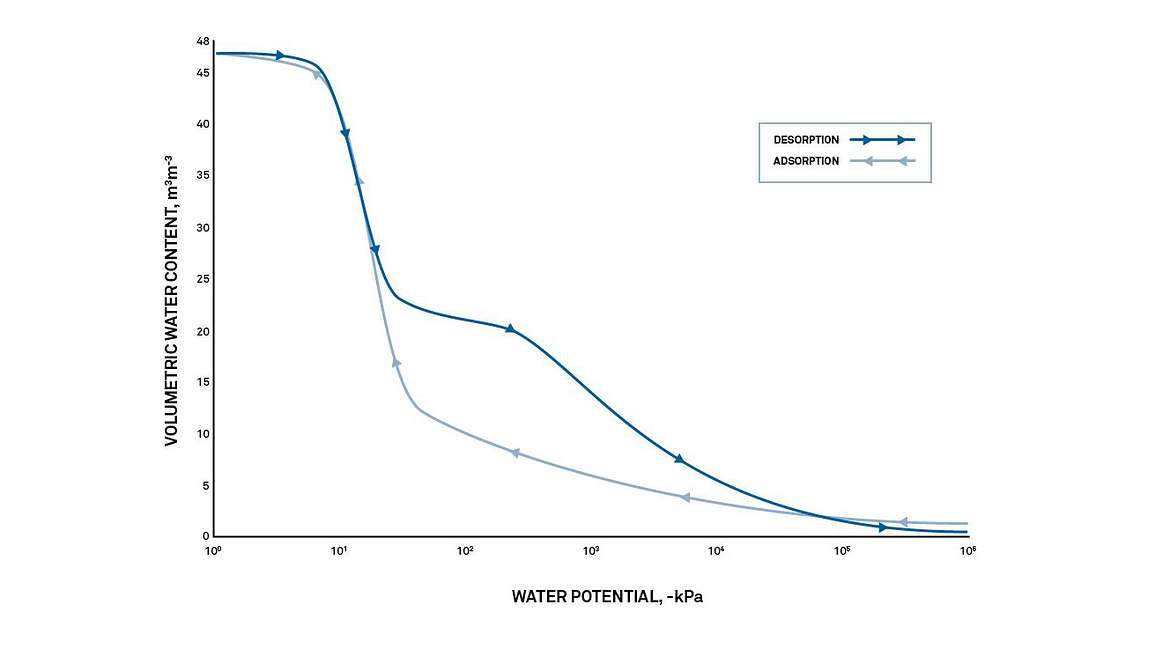
Every matrix that can hold water has a unique moisture characteristic, as unique and distinctive as a fingerprint. In soils, even small differences in composition and texture have a significant effect on the moisture characteristic.
Some researchers develop a moisture characteristic for a specific soil type and use that characteristic to determine water potential from water content readings. Matric potential sensors take a simpler approach by taking advantage of the second law of thermodynamics.
Matric potential sensors use a porous material with known moisture characteristic. Because all energy systems tend toward equilibrium, the porous material will come to water potential equilibrium with the soil around it.
Using the moisture characteristic for the porous material, you can then measure the water content of the porous material and determine the water potential of both the porous material and the surrounding soil. Matric potential sensors use a variety of porous materials and several different methods for determining water content.
Accuracy depends on custom calibration
At its best, matric potential sensors have good, but not excellent, accuracy. At its worst, the method can only tell you whether the soil is getting wetter or drier. A sensor’s accuracy depends on the quality of the moisture characteristic developed for the porous material and the uniformity of the material used. For good accuracy, the specific material used should be calibrated using a primary measurement method. The sensitivity of this method depends on how fast water content changes as water potential changes. Precision is determined by the quality of the moisture content measurement.
Accuracy can also be affected by temperature sensitivity. This method relies on isothermal conditions, which can be difficult to achieve. Differences in temperature between the sensor and the soil can cause significant errors.
Limited range
All matric potential sensors are limited by hydraulic conductivity: as the soil gets drier, the porous material takes longer to equilibrate. The change in water content also becomes small and difficult to measure. On the wet end, the sensor’s range is limited by the air-entry potential of the porous material being used.
The filter paper method was developed in the 1930s by soil scientists as an alternative to the methods then available. A specific type of filter paper (Whitman No. 42 Ashless) is used as the porous medium. Samples are equilibrated with the filter paper medium. Samples are equilibrated with the filter paper in a sealed chamber at constant temperature. Gravimetric water content of the filter paper is determined using a drying oven, and the water potential is inferred from the predetermined moisture characteristic curve of the filter paper. Deka et al. (1995) found that at least 6 days were required for full equilibration.
Range
The range of filter paper is commonly accepted to be down to -100 MPa if allowed to equilibrate fully. However, as illustrated, errors from temperature gradients become exceptionally large at water potentials near zero.
This method is inexpensive and simple, but it is not accurate. It requires isothermal conditions, which can be difficult to achieve. Small temperature variations can cause significant errors.
Gypsum blocks are often used as simple indicators of irrigation events. Gypsum blocks measure the electrical resistance of a block of gypsum as it responds to changes in the surrounding soil. The electrical resistance is proportional to water potential.
Advantages
Gypsum blocks are incredibly cheap and fairly easy to use.
Disadvantages
The readings are temperature-dependent and have very low accuracy. Also, gypsum dissolves over time, especially in saline soils, and loses its calibration properties. Gypsum blocks tell you wet or dry but not much more.
Like gypsum blocks, granular matric sensors measure electrical resistance in a porous medium. Instead of gypsum, they use granular quartz surrounded by a synthetic membrane and a protective stainless steel mesh.
Advantages
Compared with gypsum blocks, granular matric sensors last longer and work in wetter soil conditions. Performance can be improved by measuring and compensating for temperature variations.
Disadvantages
Measurements are temperature-dependent and have low accuracy. Also, even with good soil-to-sensor contact, granular matric sensors have rewetting problems after they have been equilibrated to very dry conditions because water has a reduced ability to enter the coarse medium of the granular matrix from a fine soil. Range is limited on the wet end by the air entry potential of the matrix. Granular matric sensors can only start measuring water content/potential when the largest pores in the matrix start to drain. Additionally, these sensors use a gypsum pellet, which dissolves over time, giving poor long-term stability.
Ceramic-based sensors use a ceramic disc as the porous medium. The quality of the sensor depends on the specific qualities of the ceramic.
Accuracy is limited by the fact that each disc has a somewhat unique moisture characteristic. Uniformity in the ceramic material yields greater accuracy but significantly limits the range. Custom calibration of each individual sensor improves accuracy dramatically but is time consuming. Recent innovations in calibration technique may offer better commercial calibration options.
Range is limited on the wet end by the air entry potential of the ceramic. Ceramic-based sensors can only start measuring water content/potential when the largest pores in the ceramic start to drain. On the dry end, range is limited by the total porosity contained in small pores that drain at low water potentials.
Two types:
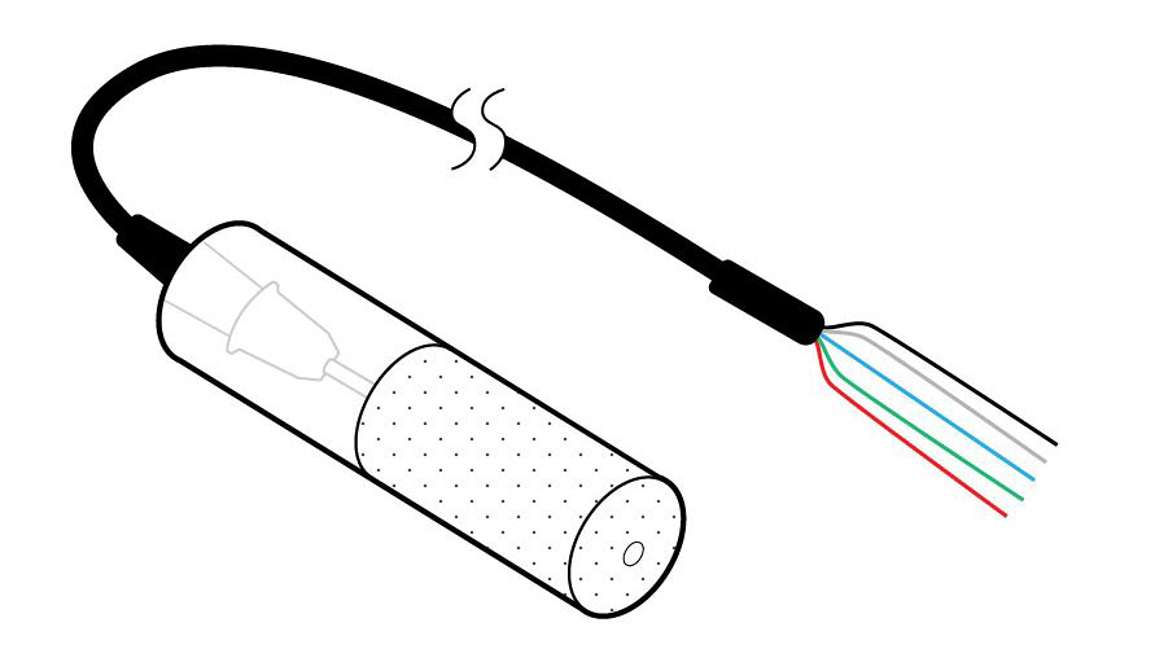
The heat dissipation sensor measures moisture content of the ceramic by measuring its thermal conductivity. Using a ceramic cylinder containing a heater and a thermocouple, it measures baseline temperature, heats for a few seconds, and then measures temperature change. By plotting the change in temperature vs. log time, it determines the moisture content of the ceramic. Moisture content is translated into water potential using the moisture characteristic of the ceramic disc. Note that because the sensor is heated, it must be powered by a system with large power reserves (e.g., Campbell Scientific data logger or equivalent).
Accuracy
Unless it is individually custom-calibrated, the heat dissipation sensor has only moderate accuracy.
Range
On the very dry end, there is a lot of sensitivity in the thermal conductivity curve, which gives heat dissipation sensors extended usefulness in the dry range (-1 to -50 mPa). On the wet end, the heat dissipation sensor is limited by the air entry potential of the ceramic.
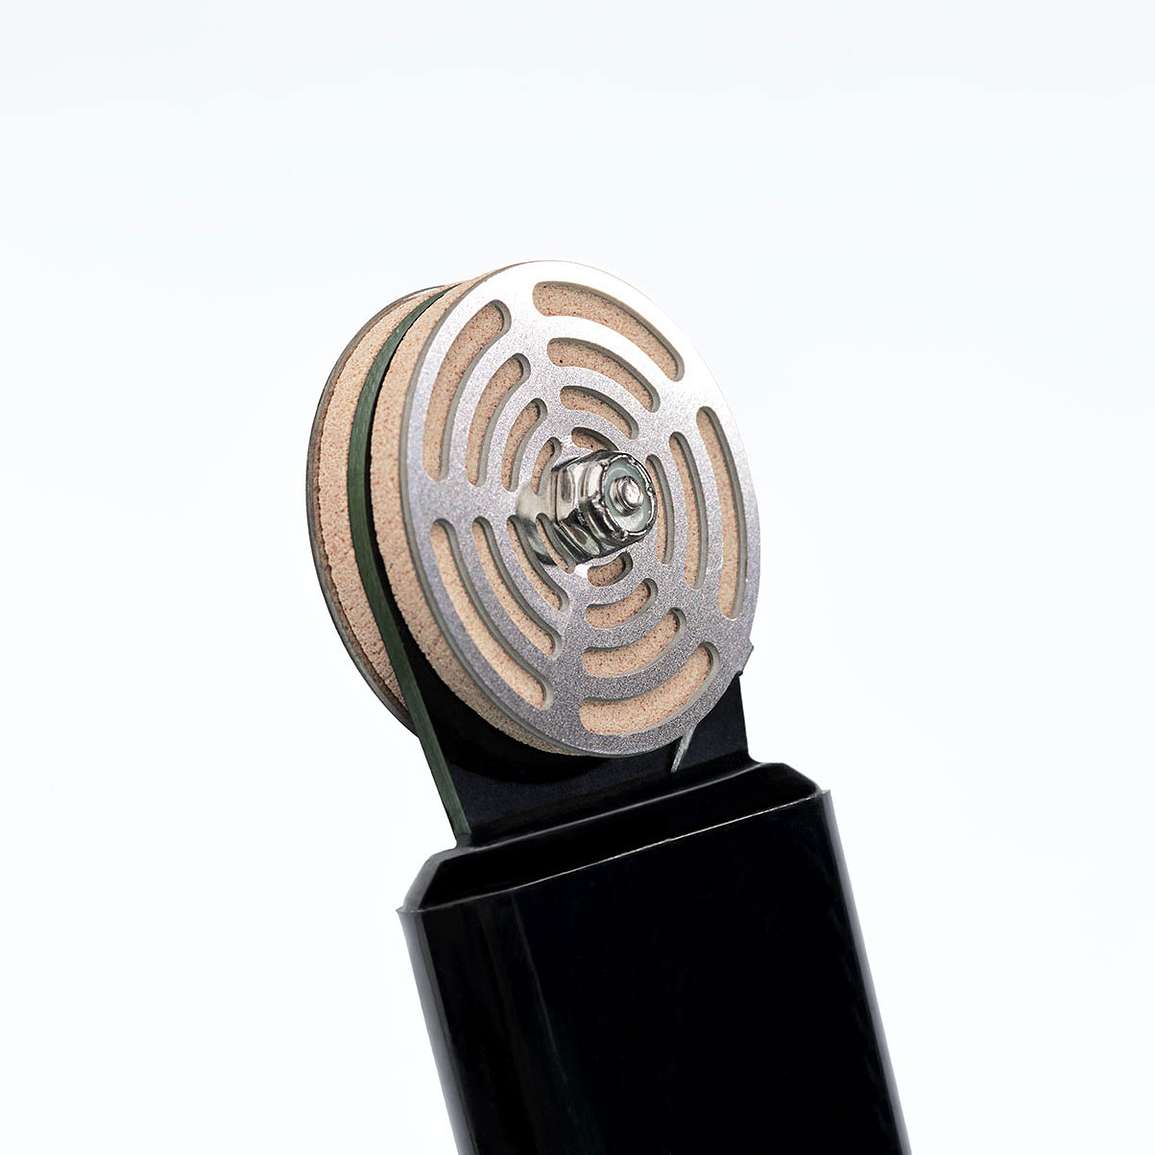
Dielectric matric potential sensors measure the charge-storing capacity of a ceramic disc to determine its water content. They then use the moisture characteristic of the disc to convert water content to water potential.
Because they use a dielectric technique, the sensors are highly sensitive to small changes in water. Like all ceramic-based sensors, matric potential sensors require custom calibration for good accuracy.
Advantages
Dielectric matric potential sensors are low power and maintenance-free.
Disadvantages
Without calibration, the sensors have an accuracy of just ±40% of the reading. However, a recent, custom-calibrated version of the sensor promises an accuracy of ±10% of the reading.
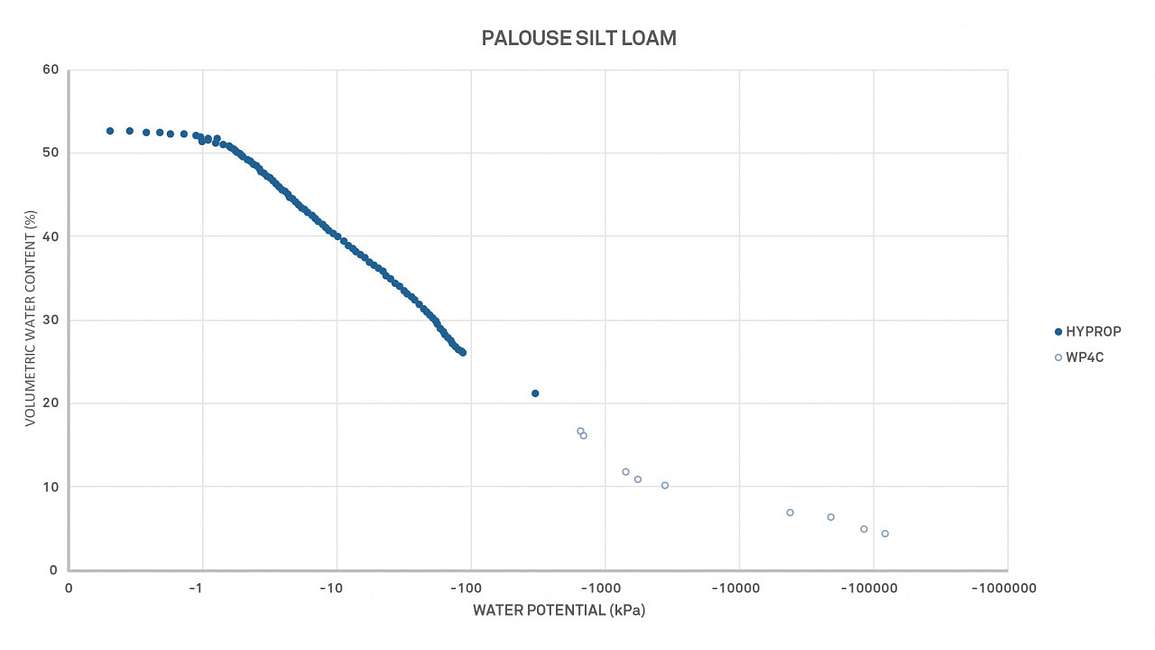
Leo Rivera teaches the skills needed to create a soil-water characteristic curve with wet end tensiometer data (HYPROP) and dry end dew point data (WP4C) that actually match up in the middle.
These techniques potentially make it possible for researchers to push their instruments past their specifications. Learn about issues surrounding these measurements, including the effects of hysteresis and changes in sample preparation methods required when you move into the wet range.
WATER POTENTIAL IN ACTION
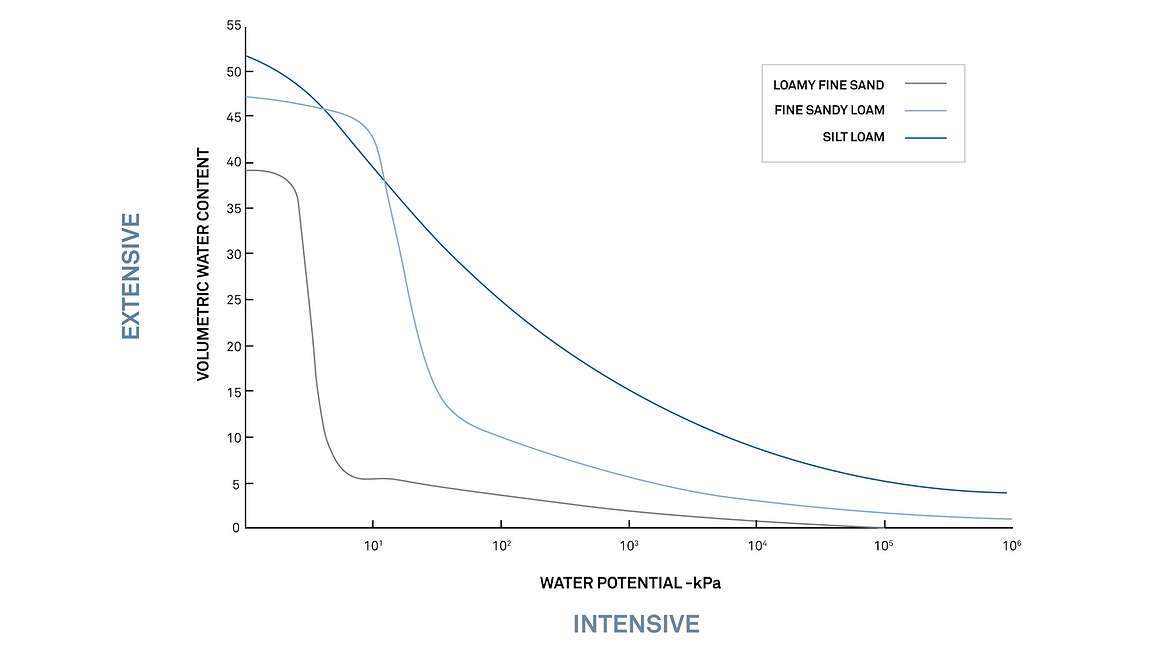
Soil moisture release curves (also called soil-water characteristic curves or soil water retention curves) are like physical fingerprints, unique to each soil type. Researchers use them to understand and predict the fate of water in a particular soil at a specific moisture condition. Moisture release curves answer critical questions such as: at what moisture content will the soil experience permanent wilt? How long should I irrigate? Or will water drain through the soil quickly or be held in the root zone? They are powerful tools used to predict plant water uptake, deep drainage, runoff, and more.
There is a relationship between water potential and volumetric water content which can be illustrated using a graph. Together, these data create a curve shape called a soil moisture release curve. The shape of a soil moisture release curve is unique to each soil. It is affected by many variables such as soil texture, bulk density, the amount of organic matter, and the actual makeup of the pore structure, and these variables will differ from site to site and from soil to soil.

Figure 9 shows example curves for three different soils. On the X-axis is water potential on a logarithmic scale, and on the Y-axis is volumetric water content. This relationship between soil water content and water potential (or soil suction) enables researchers to understand and predict water availability and water movement in a particular soil type. For example, in Figure 1, you can see that the permanent wilting point (right vertical line) will be at different water contents for each soil type. The fine sandy loam will experience permanent wilt at 5% VWC, while the silt loam will experience permanent wilt at almost 15% VWC.
Soil moisture release curves can be made in situ or in the lab. In the field, soil water content and soil water potential are monitored using soil sensors.
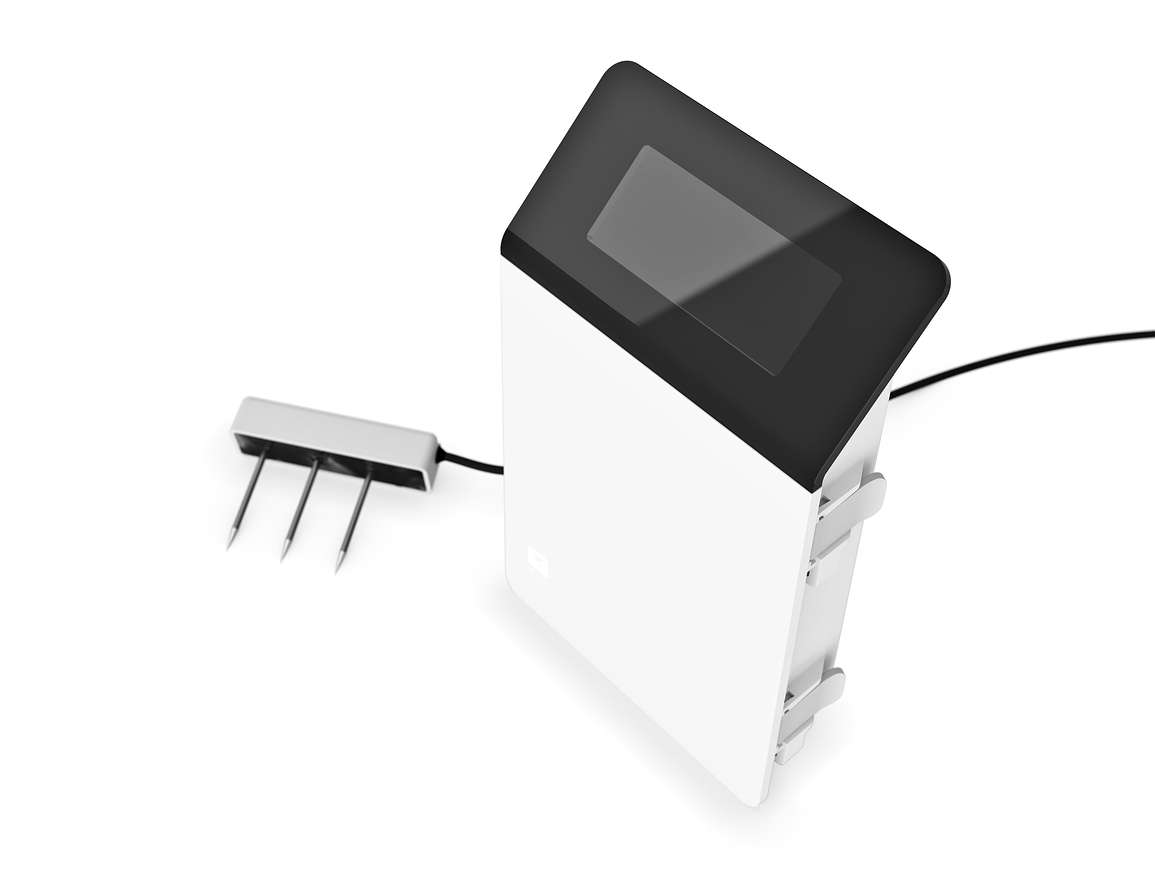
METER’s easy, reliable dielectric sensors report near-real-time soil moisture data directly through the ZL6 data logger to the cloud (ZENTRA Cloud). This saves an enormous amount of work and expense. The TEROS 12 measures water content and is simple to install with the TEROS borehole installation tool. The TEROS 21 is an easy-to-install field water potential sensor.
In the lab, you can combine METER’s HYPROP and WP4C to automatically generate complete soil moisture release curves over the entire range of soil moisture.
See how lab and in situ moisture release curves compare
A soil moisture release curve ties together the extensive variable of volumetric water content with the intensive variable of water potential. Graphing the extensive and intensive variables together allows researchers and irrigators to answer critical questions, such as where soil water will move. For example, in Figure 10 below, if the three soils below were different soil horizon layers at 15% water content, the water in the loamy fine sand would begin to move toward the fine sandy loam layer because it has a more negative water potential.
A soil moisture release curve can also be used to make irrigation decisions such as when to turn the water on, and when to turn it off. To do this, researchers or irrigators must understand both volumetric water content (VWC) and water potential. VWC tells the grower how much irrigation to apply. And water potential shows how available that water is to crops and when to stop watering. Here’s how it works.
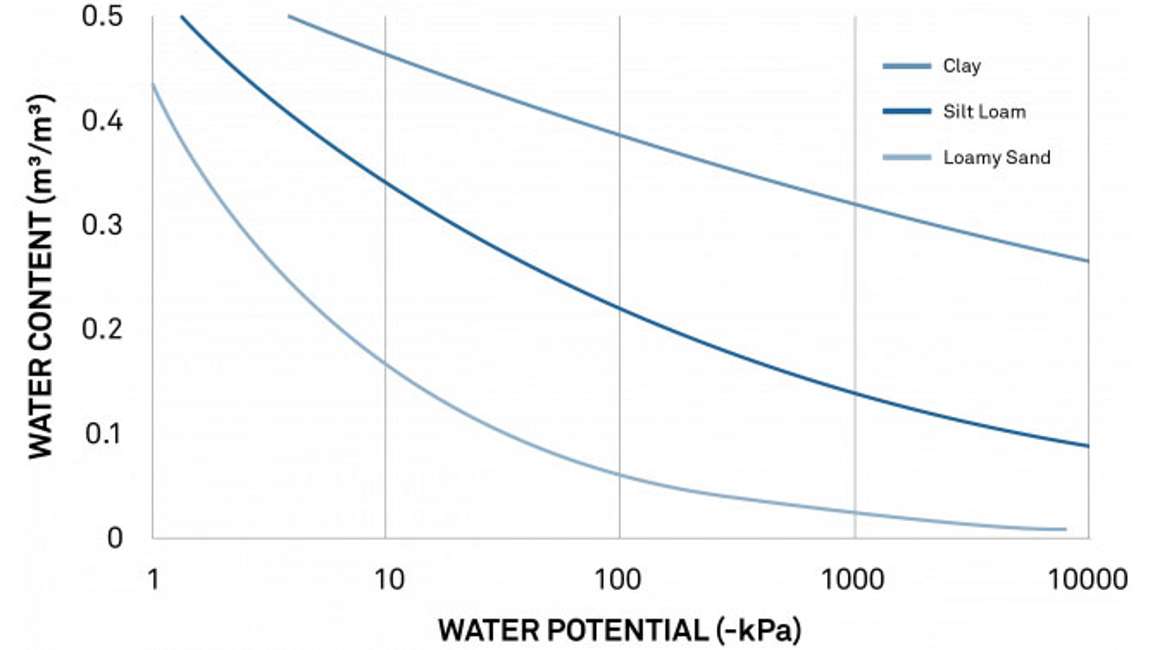
Figure 11 shows typical moisture release curves for a loamy sand, a silt loam, and a clay soil. At -100 kPa, the sandy soil water content is below 10%. But in the silt loam, it’s approximately 25%, and in the clay soil, it’s close to 40%. Field capacity is typically between -10 and -30 kPa. And the permanent wilting point is around -1500 kPa. Soil that is drier than this permanent wilting point wouldn’t supply water to a plant. And water in a soil wetter than field capacity would drain out of the soil. A researcher/irrigator can look at these curves and see where the optimal water content level would be for each type of soil.
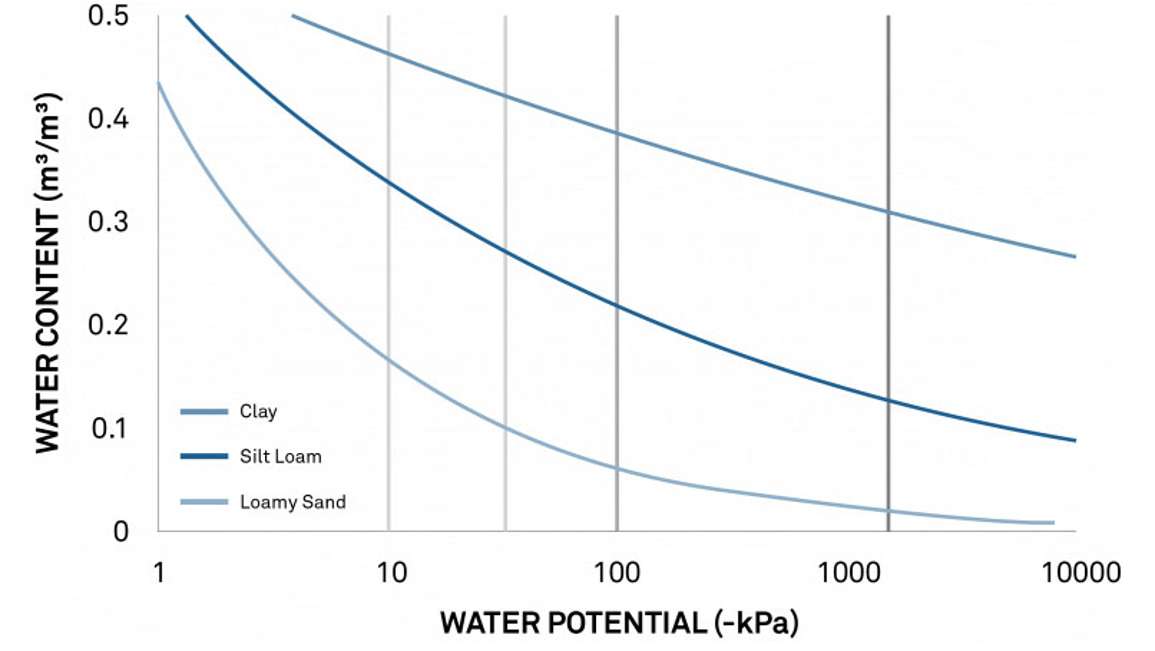
Figure 12 is the same moisture release curve showing the field capacity range (green vertical lines), the lower limit normally set for an irrigated crop (yellow), and the permanent wilting point (red). Using these curves, a researcher/irrigator can see the silt loam water potential should be kept between -10 and -50 kPa. And the water content that corresponds to those water potentials tells the irrigator that the silt loam water content levels must be kept at approximately 32% (0.32 m3/m3). Soil moisture sensors can alert him when he gets above or below this optimal limit.
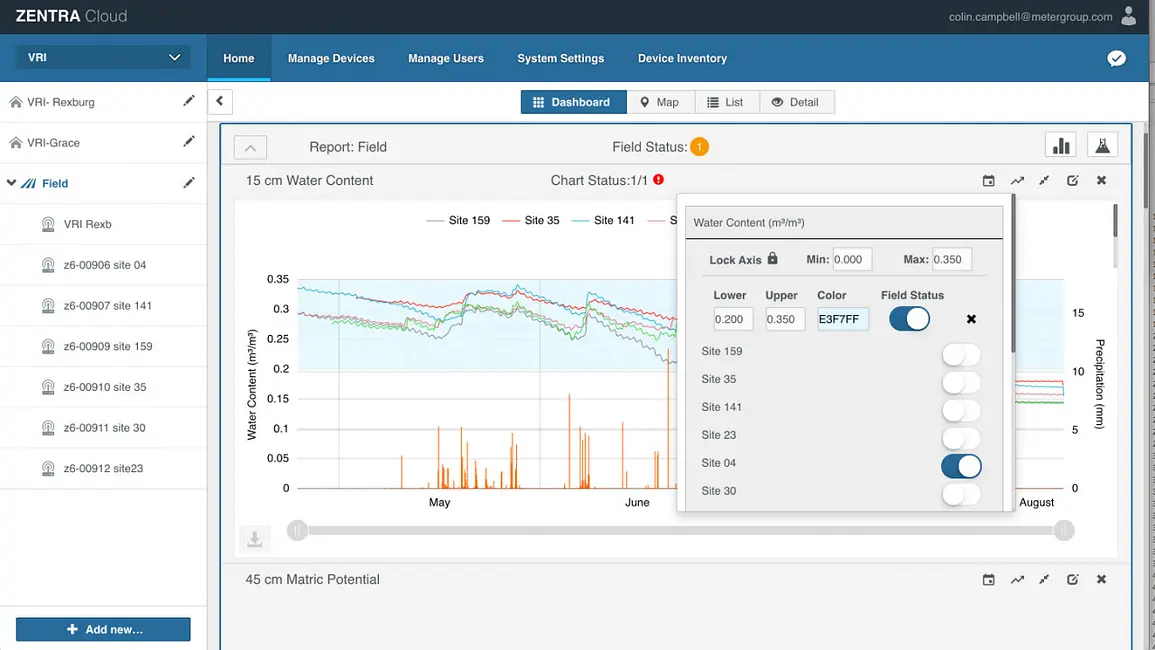
Once information is gleaned from a release curve, METER’s ZL6 data logger and ZENTRA Cloud simplify the process of maintaining an optimal moisture level. Upper and lower limits can be set in ZENTRA cloud (Get a live demo), and they show up as a shaded band superimposed over near-real-time soil moisture data (blue shading), making it easy to know when to turn the water on and off. Warnings are even automatically sent out when those limits are approached or exceeded.
Learn more about improving irrigation with soil moisture
15-20 years ago, it took months to get a full, detailed soil moisture release curve in the lab, but we’ve come a long way since then. Why?
Moisture release curves have always had two weak areas: a span of limited data between 0 and -100 kPa and a gap from -100 kPa to -1000 kPa where no instrument could make accurate measurements. Between 0 and -100 kPa, soil loses half or more of its water content. Using pressure plates to create data points for this section of a moisture release curve meant the curve was based on only five data points.
And then there’s the gap. The lowest tensiometer readings cut out at -0.085 MPa, while historically the highest WP4 water potential meter range barely reached -1 MPa. That left a hole in the curve right in the middle of the plant-available range.
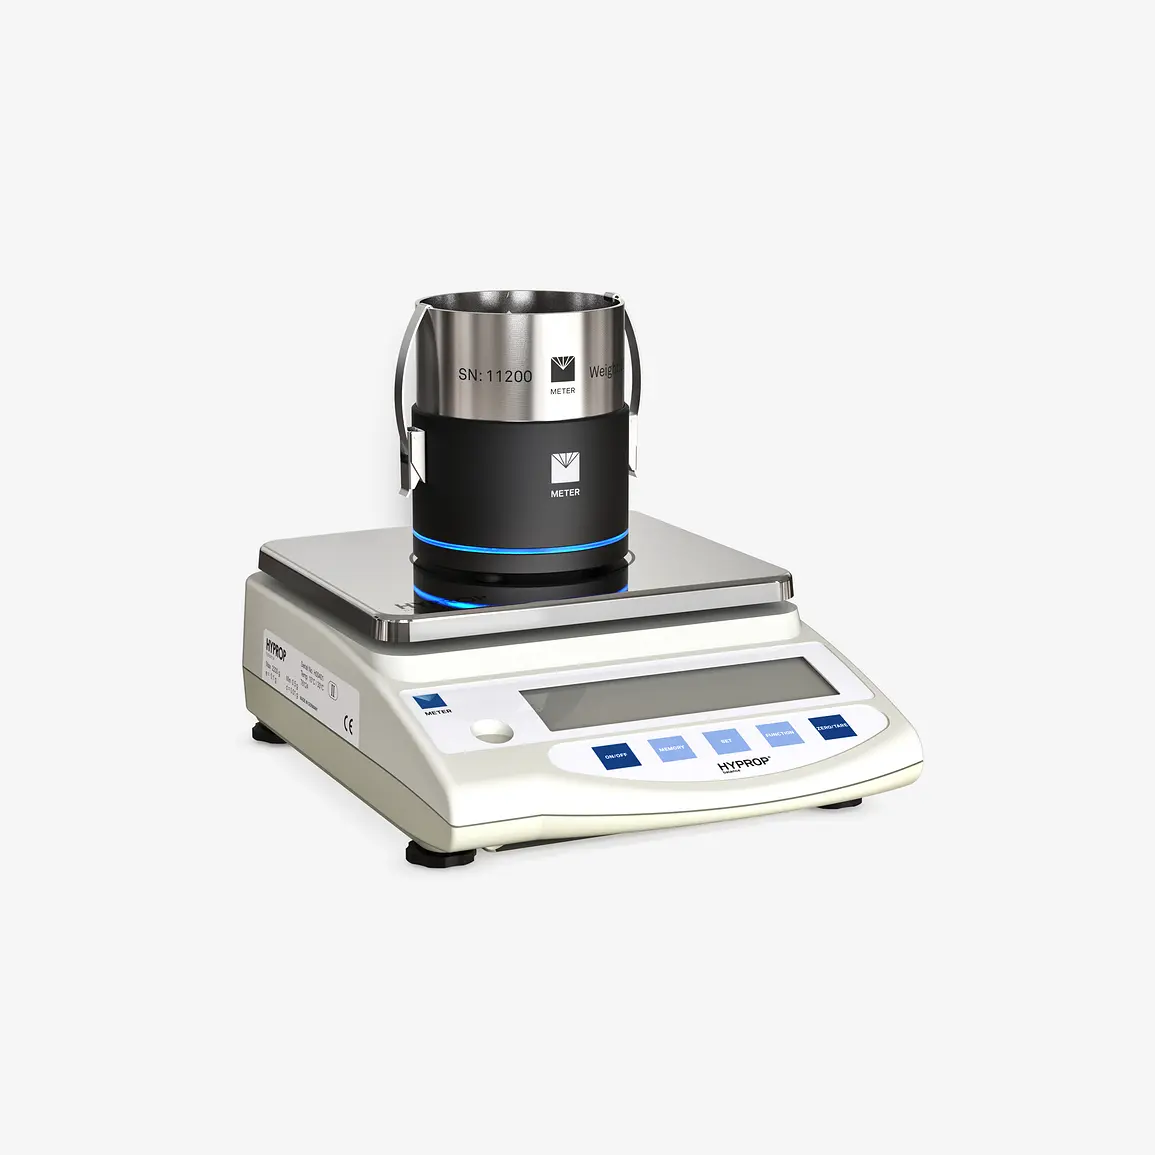
In 2008, METER Group AG in Germany released the HYPROP, an instrument capable of producing over 100 data points in the 0 to -0.1 MPa range. This solved the resolution issue with more than 20 times the data behind that section of the curve.
In 2010, METER Group released the redesigned WP4C water potential meter. Significant accuracy and range gains now allow the WP4C to make good readings all the way up to the tensiometer range. Using HYPROP with the redesigned WP4C, a skilled experimenter can now make complete, high-resolution moisture release curves. For in-depth information about how to make full soil moisture release curves in the lab, see our Moisture Release Curve App Guide.
Soil moisture release curves can provide even more insight and information beyond the scope of this article. Researchers use them to understand many issues like soil shrink-swell capacity, cation exchange capacity, or soil-specific surface area.
Want to learn how soil moisture release curves can be used in your application? Contact us—Our soil scientists have decades of experience helping researchers measure the soil-plant-atmosphere continuum. Or watch our soil moisture release curve webinar: Soil Moisture 201: Moisture Release Curves—Revealed.
Understanding unsaturated water flow in soils
At the turn of the last century, the USDA Bureau of Soils (BOS) recruited several pure physicists to tackle perplexing problems in agriculture. One of these was Edgar Buckingham. When Buckingham came to the Bureau of Soils in 1902, he had already authored a text on thermodynamics. His first experiments at the BOS involved gas transport in soils, but ultimately he came to consider the problem of unsaturated water flow in soil, and this is where he made his greatest contribution to soil physics.
As a classical physicist, Buckingham used mathematics to examine the mysteries and confusion surrounding how water flows in soil. Realizing that water content did not drive flow in unsaturated soil, Buckingham’s challenge was to describe the forces that did. He was naturally familiar with electrical and thermal force fields and the flux they created. These concepts were comfortable analogs for the driving force created in soil by gradients in what he called “capillary conductivity.” Buckingham used Ohm’s and Fourier’s laws to describe this flux.
1902: Edgar Buckingham comes to work for the Bureau of Soils. His experience in thermodynamics helped form the beginning of our understanding of unsaturated water flow in soils.
1930s: L.A. Richards develops the pressure plate, one of the first instruments capable of effectively measuring “capillary conductivity”.
1940s: L.A. Richards and John Monteith publish papers describing how thermocouple psychrometers could be used to measure the water potential of soil samples.
1951: D.C. Spanner is the first to successfully demonstrate the use of a thermocouple psychrometer to measure water potential in soil.
1983: METER introduces the first commercially available thermocouple psychrometer (the SC-10 later known as the TruPsi).
Although Edgar Buckingham described and demonstrated “capillary conductivity” in 1907, he was a long way from being able to measure it effectively. The first instrument to do that was the pressure plate created by L.A. Richards in the 1930s. A pressure plate doesn’t measure the water potential of a sample. Instead, it brings a sample to a specific water potential. The instrument applies pressure to force water out of the sample and into a porous ceramic plate. When the sample comes to equilibrium, its water potential will theoretically be equivalent to the pressure applied.
Once the soil samples reach a specific water potential under pressure, the researcher can measure the correlated water content. A soil moisture characteristic can be made by making these measurements at different pressures.
Over a decade after the introduction of the pressure plate, L. A. Richards in the U.S. and John Monteith in Britain published papers describing how a thermocouple psychrometer could be used to measure the water potential of soil samples by equilibrating the sample with vapor in a closed chamber and measuring the relative humidity of the vapor. At equilibrium, the relative humidity of the vapor is directly related to the water potential of the sample.
The term psychrometer, coined in 1818 by the German inventor Ernst Ferdinand August (1795-1870), means “cold measurer” in Greek. A psychrometer is made of two identical thermometers. One (the dry bulb) is kept dry while the other (the wet bulb) is kept saturated. The difference in temperature between the wet and the dry bulb temperatures can be used to calculate the relative humidity of the air.
The first psychrometers used to measure relative humidity above a soil sample were of necessity quite small. The two thermometers were made of tiny, fragile thermocouples. A thermocouple is a temperature sensor made from two dissimilar conductors joined at one spot. The thermocouple converts a temperature gradient into electricity, which can be measured to determine temperature changes.
Thermocouple psychrometers were first successfully used to measure water potential by D.C. Spanner before 1951, but it was a difficult measurement to make. To get the results he wanted, Spanner had to make his own wire out of bismuth antimony—according to John Monteith, a fume hood at Rothamsted bore the marks of these experiments for many years.
Others struggled to repeat his measurements. Samples took up to a week to equilibrate, and then the fragile thermocouples would often read just one sample before they were broken. Still, by 1961 Richards clearly saw vapor methods as the future of water potential measurements (Richards and Ogata, 1961).
Decagon (now METER) introduced its first commercial thermocouple psychrometer (the SC-10 Thermocouple Psychrometer Sample Changer, later TruPsi) in 1983. This instrument used a delicate thermocouple but protected it inside a sealed enclosure. Nine samples were equilibrated simultaneously and rotated under the thermocouple to be measured.
Prior to each measurement, the wet bulb thermocouple was dipped in a tiny reservoir of water. The electrical output of the thermocouple was sent to a nanovoltmeter, which had to be monitored to determine when the temperatures stopped changing.
In the late 1990s, Decagon (now METER) started producing the WP4C Dew Point Potentiameter, an improved method for measuring water potential using vapor pressure. Like the psychrometer, it measures the vapor pressure above a sample sealed inside a chamber. Both instruments are primary methods based on thermodynamic principles.
Unlike the psychrometer, the dew point potentiameter uses a chilled-mirror dew point sensor. A small mirror in the chamber is chilled until dew just starts to form on it. At the dew point, the WP4C measures both mirror and sample temperatures with 0.001 °C accuracy to determine the relative humidity of the vapor above the sample. The water potential of the sample is linearly related to the difference between the sample temperature and the dew point temperature.
The dew point sensor has several advantages. It is faster and gives accurate measurements even when the operator is relatively unskilled. Also, the chilled mirror sensor doesn’t require added water and therefore doesn’t increase the water content of the vapor above the sample.
This measurement has the advantage of being a primary method for determining water potential based solidly on thermodynamic principles rather than on calibration.
The most recent version of this instrument can resolve temperatures to a thousandth of a degree, making it possible to measure samples as wet as -0.5 MPa with excellent accuracy.
Our scientists have decades of experience helping researchers and growers measure the soil-plant-atmosphere continuum.
Everything you need to know about measuring soil moisture—all in one place.
Six short videos—everything you need to know about how to nail your GDD predictions.
Six short videos—everything you need to know about soil water content and soil water potential—and why you should measure them together.

Receive the latest content on a regular basis.