NDVI (normalized difference vegetation index) and PRI (photochemical reflectance index)—The researcher’s complete guide
Get an in-depth look at the scientific theory, measurement methods, and application of NDVI and PRI.

Years ago, we received an irrigation management call from a couple of scientists, Drs. Bryan Hopkins and Neil Hansen, about the sports turfgrass they were growing in cooperation with the Certified Sports Field Managers at Brigham Young University (BYU) and their turfgrass research and education programs. They wanted to optimize performance through challenging situations, such as irrigation controller failure and more. Together, we began intensively examining the water in the root zone.

As we gathered irrigation and performance data over time, we discovered new critical best practices for managing irrigation in turfgrass and other crops, including measuring “soil water potential (soil suction)”. We combined soil water potential sensors with traditional soil water content sensors to reduce the effort it took to keep the grass performance high while saving water costs and reducing disease potential and poor aeration. We also reduced fertilization costs by minimizing leaching losses out of the root zone due to overwatering.
In this article, we’ll use turfgrass and potatoes to show how to combine data from water potential and water content sensors, but these best practices apply to any type of crop grown by irrigation scientists, agronomists, crop consultants, outdoor growers, or greenhouse growers. By adding water potential sensors to his water content sensors, one Idaho potato grower cut his water use by 38%. This reduced his cost of water (pumping costs) per 100 lbs. of potatoes, saving him $13,000 in one year. But that’s not even the best part. His yield increased by 8% and he improved his crop quality—the rot he typically sees virtually disappeared.
In simple terms, soil water potential is a measure of the energy state of water in the soil. It has a complicated scientific definition, but you don’t have to understand what soil water potential is to use it effectively. Think of it as a type of plant thermometer that indicates “plant comfort”—just as a human thermometer indicates human comfort (and health). Here’s an analogy that explains the concept of soil water potential in terms of optimizing irrigation.
After an afternoon of sledding, two kids trudged back to an icy cabin. They hurried to build a fire to warm up and dry out. They kept adding more and more logs so they would be comfortable, but soon the cabin was sweltering. In an attempt to cool down, they let the fire die and were soon shivering. Clearly, they were missing a fundamental understanding of “the amount” of logs needed to be warm and comfortable in the cabin.
A similar problem existed for a Wisconsin professor named Warren S. Johnson in the late 1800s. Finding the janitor to add coal to a furnace downstairs to keep his students comfortable was an imprecise and time-consuming effort. He could have tried to calculate how much heat each piece of coal contained, the size of the room, and how much heat existed already. But instead, he invented a simple device called a thermostat. This invention used temperature and a bell down in the basement to alert the janitor to add more coal when the room dropped below the optimum temperature range for their comfort. The thermostat became the primary product of Johnson Controls, a company that still exists today.
Managing soil water for plant growth has many parallels to these stories. Often when people manage irrigation water, they recognize that a plant is struggling and add water to make it comfortable again. The problem is, just like the boys in the cabin, they add too much water because they don’t know where the upper limit is or “how much” water is enough. Then they let the soil dry out again to a point where it’s parched. This cycle is repeated over and over. In other cases, they are so afraid of brown spots, they keep the soil near saturation, which is wasteful of water and harmful to plants. Many irrigators think installing a soil water content sensor will fix this problem, but they are mistaken. This approach has similar problems to adding logs to the fire.
A water content sensor can only tell you “how much” water is in the soil. It can’t tell you if that amount is optimal for plants. A soil water potential sensor will give you that information. With water potential, you measure a parameter that—like temperature—will tell you about the energy of water in the soil, or how much soil water is available to your plants.
Everyone is familiar with temperature. We’re constantly checking the temperature to make decisions, but in doing so we rarely, if ever, think about its complicated definition as the energy state of a system. We simply know what it means to our comfort. We understand the units (degrees) without knowing how they’re tied to the third law of thermodynamics.
Soil water potential is a far less familiar term that defines the energy state of water in soil and is analogous to temperature. It defines the water comfort range of plants in a similar way that temperature defines the comfort range for humans. Simply put, it’s the thermometer for plant water. Some resist using water potential because it’s hard to understand. But while its definition is complex, the plant “comfort ranges” are well established. So there’s no need to deeply understand the measurement to get the benefits.
The following table is taken from Physical Edaphology, a book by Dr. Sterling Taylor that outlines some established crop comfort ranges in units of kPa. There are also many other research papers in the literature that list comfort ranges of various plants.
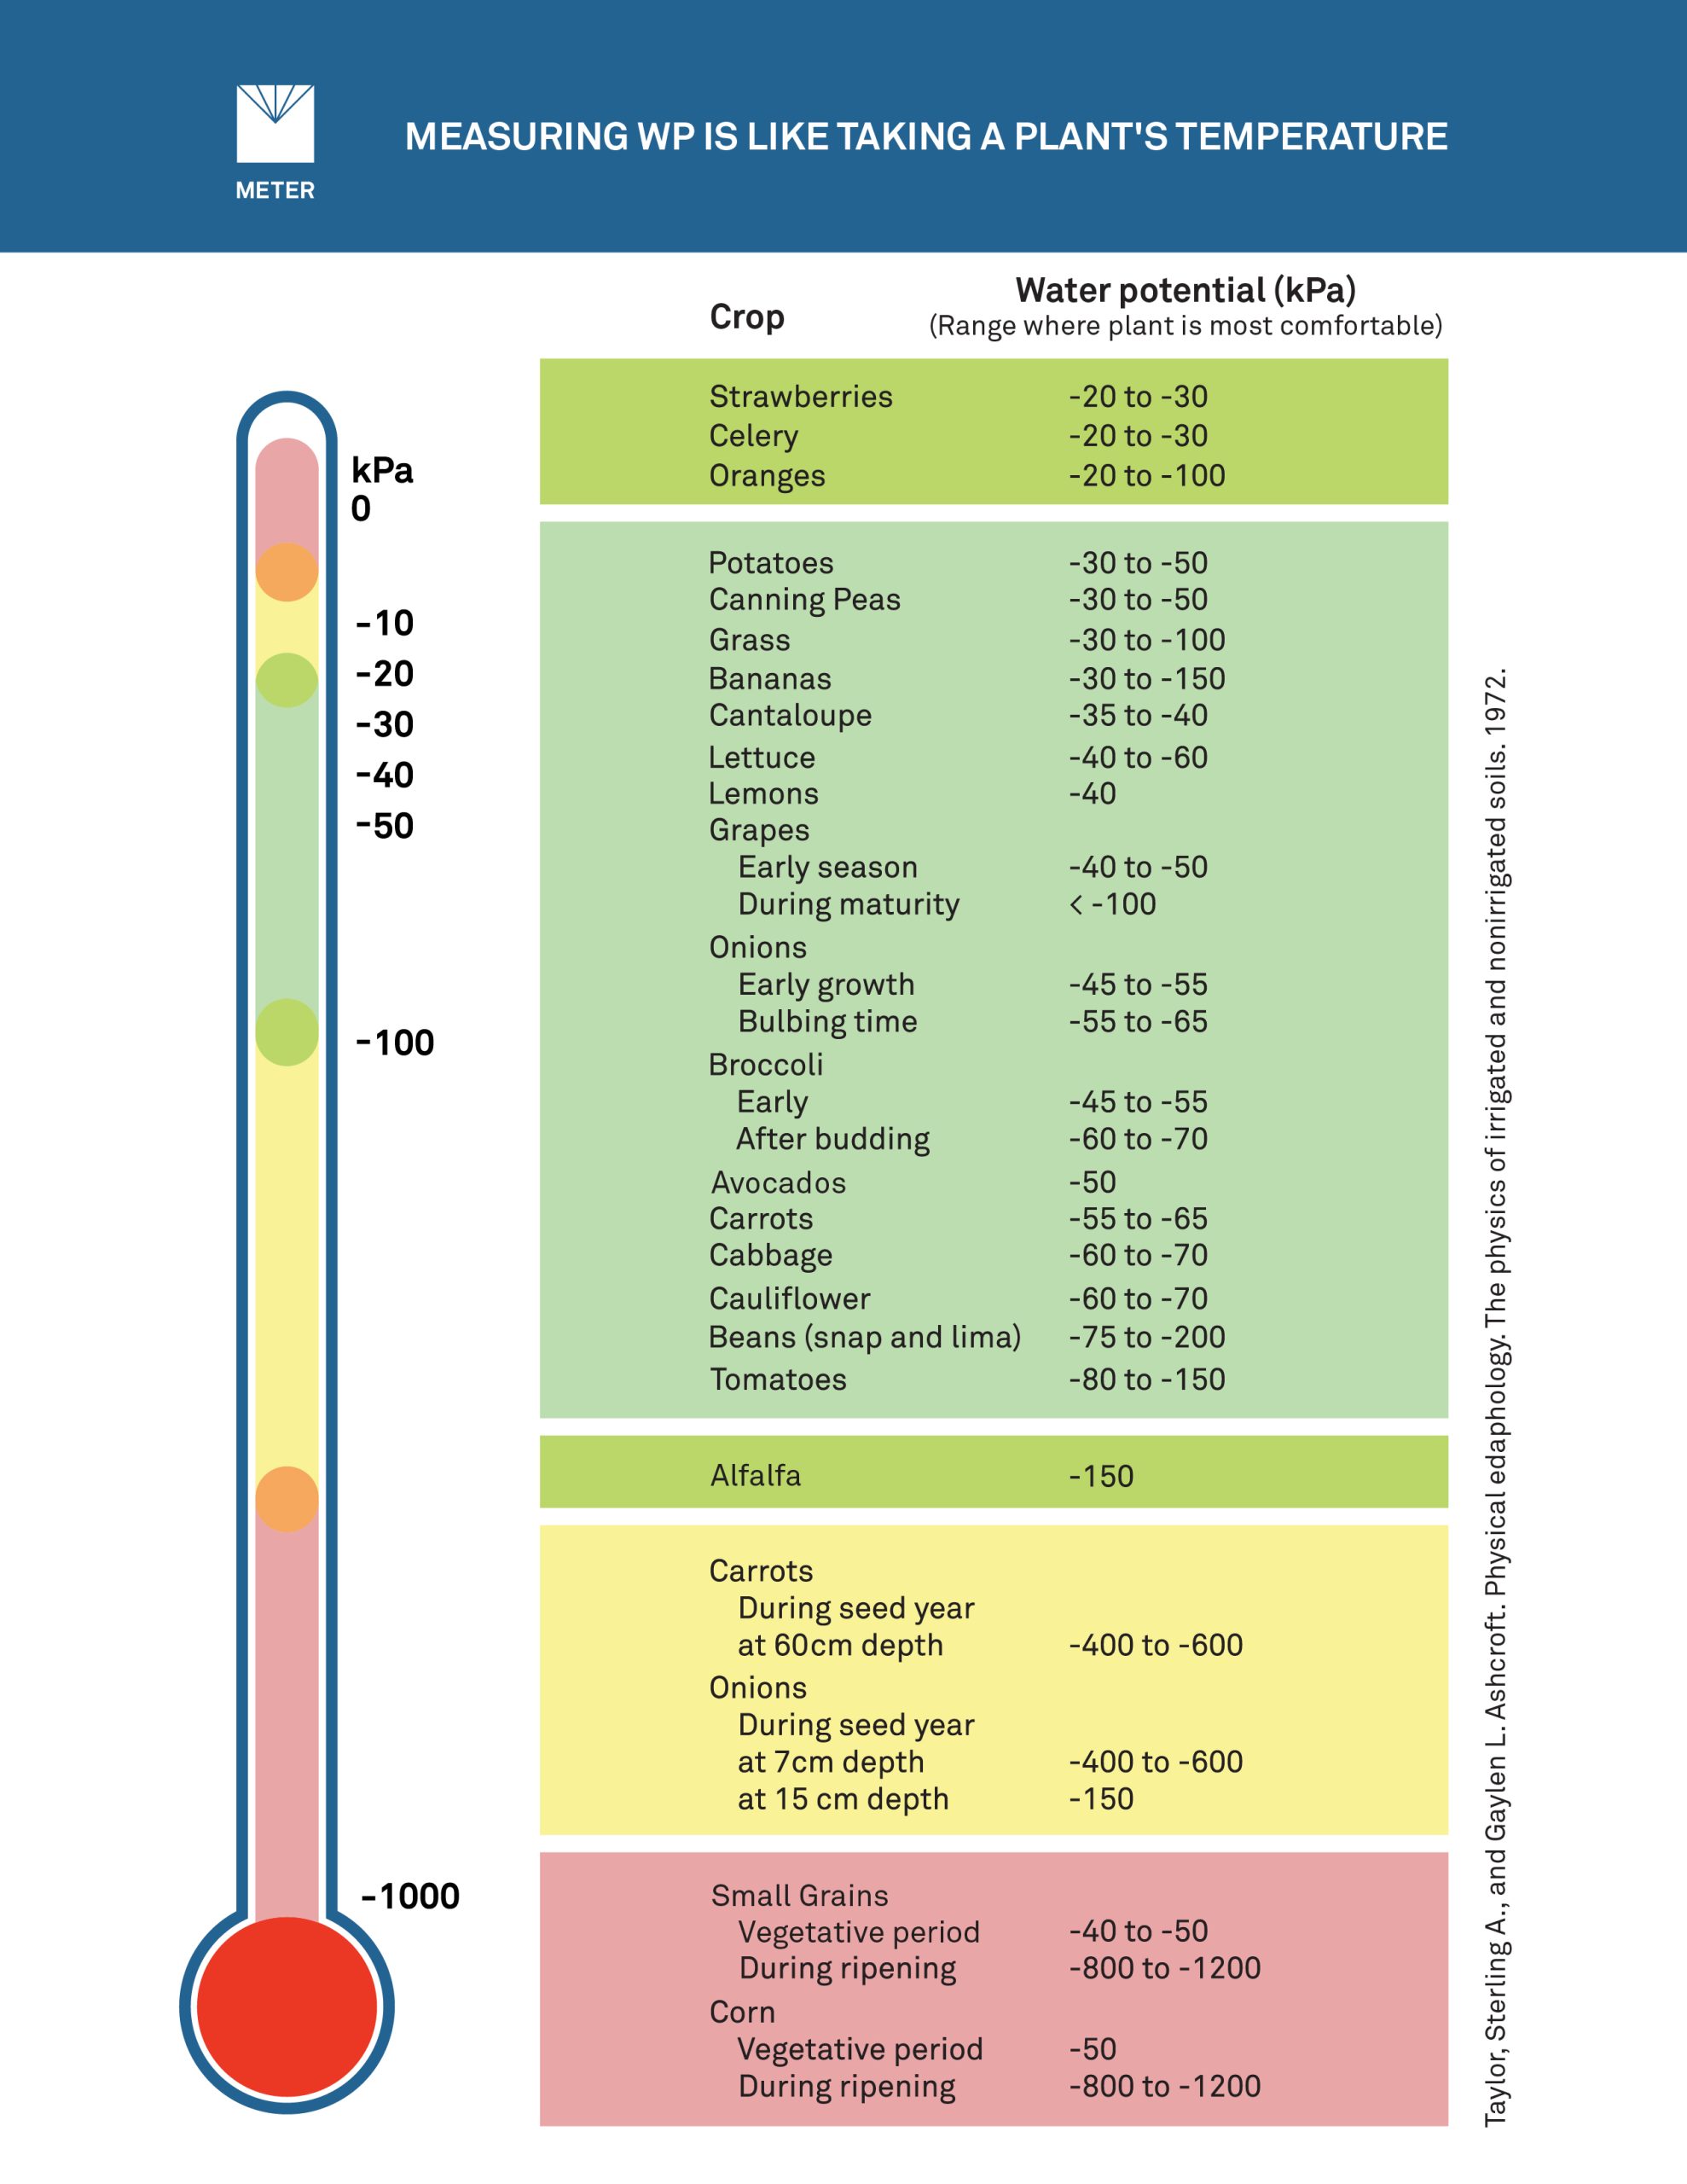
For example, the comfort range of a potato plant is about -30 to -50 kPa. If you keep your plant within that comfort range, you can avoid plant-water stress. You may not know what a kPa is, in the same way that you may not know exactly what a Fahrenheit degree is. But, you can still use that scale to measure the “comfort” of your plant. In our experience, an optimal comfort range for closely mowed turfgrass is between -20 to -100 kPa. (L.J Aronson, A.J. Gold, and R.J. Hull. 1987. Cool-Season Turfgrass Response to Drought Stress. Crop Science. 27:1261 – 1266).
For a deeper look at the difference between water content and water potential, watch our Soil Moisture 101 webinar.
Because we often work with potato growers to optimize irrigation management, we’ll illustrate this point with potato irrigation data, but the same principles apply to turfgrass and other crops. Figure 2 shows potato yield at six different locations in a 40-hectare field. Clearly, the longer the potato plants stay in the stress range (below -100 kPa), the larger the yield loss.

This same concept applies for all plants. Obviously, the goal for turfgrass is a consistent, robust, stable playing field that looks great (as opposed to producing yield), but the concepts are the same. Managing turfgrass within its water comfort zone will result in healthier plants by providing the proper balance of root zone water and air. It also minimizes disease and preserves nutrients. And it conserves water and enhances the quality of the playing surface. The same is true for other crops: keeping plants within their optimal zone results in healthier plants, which means higher quality and yield. With today’s challenging freshwater situation, these are powerful tools to help with conservation.
Some people resist using soil water potential for irrigation management because historically it’s been hard to measure. But this is no longer true. Over the years, many devices were created to measure soil water potential but generally suffered from debilitating problems such as inaccuracy, poor repeatability, and disappointing longevity. But like most technology, advancements have overcome many of these problems. We’ve been installing these next-generation sensors in turfgrass and other crops, and we’ve learned much.

All plants have a strong relationship between soil water potential and their performance or behavior. Why not just measure soil water potential to control irrigation? You do the same thing when setting the thermostat temperature. It does not tell you how much energy it will take to heat or cool, but by setting the temperature threshold, you know you’ll be comfortable. Can you do the same thing in the soil? Yes, you could simply turn the water on long enough to bring the water potential back to the top of the comfort range; this is commonly done.
However, there are a few potential problems. First, you may not want to irrigate at the exact time the sensor determines you need it (like in the middle of play or when evaporative conditions are high). Second, some soils may experience a lag time between when you apply water and when the water potential returns to “comfortable”, so it would help to know how much water is being used to know how much to apply. This is why you need to measure water content in addition to water potential for optimal irrigation management.

Since water content is easier to measure in the soil, many use it to schedule irrigation, but it can sometimes leave them in the dark. To see why, let’s look at some data collected in the field. Don’t worry if the graphs look complicated. We’ll explain what is important to focus on.
Consider the soil water content trends in Figure 5 under regular sprinkler irrigation. Because the water content drops only 3% over the entire summer, you might conclude plants grown in the soil were not in stress. You may even justify this conclusion by looking at how high the water content is (almost 30% or more). But remember, just like you can’t tell how many logs it takes to keep you warm, you can’t tell “how much” water the plants need to be comfortable without more information.

Look at the soil water potential in Figure 6. These are measurements at the same site! Some of the locations remain in the stress range for the majority of the summer. In this specific case, the manager was not aware of the problem and even suggested (without seeing the site) that there may be a problem with the sensors. We visited the site and found the sensors were correct. He now has a number of soil water potential sensors installed and trusts them before any other measurement for optimizing irrigation management.

Soil water potential is a measure of how tightly the soil is holding on to the water. If the water potential (or tension) is too strong, the water won’t be available to the plants. While it’s easy to see stress conditions in Figure 6, it is not evident in the water content (Figure 5).
While the manager in the last example eventually just used water potential for irrigation management, he also had the luxury of working a heavy soil. Let’s take a look at another example. We installed sensors in and below the root zone of a high performance turfgrass grown in ASTM spec (F2396 – 11) sand-based sports field. It gave us an opportunity to see how we were doing with calendar-based vs. sensor-controlled irrigation.
We broke up the evaluation into three periods (shown in Fig. 7) over an entire summer: standard calendar-based irrigation, fixed drying periods (based on soil water potential), and finally an extreme drying period. The next three figures will show data in detail for each of these tests.

The root zone in this particular turfgrass was approximately 15 cm, so we installed water content and tension sensors at 6 and 15 cm, respectively, with a single water content sensor at 25 cm to see what water was washing beyond the roots and wasted.
When we started to review the data shown in Figure 8, we knew that the calendar irrigation was resulting in over irrigation.

The soil water potential was stuck near 0 kPa (yes, you can be above the comfort zone and cause problems too). And each irrigation event brought a jump in the water content below the root zone (25 cm). Clearly, we needed to dial back. Our goal was to get the tension in the optimal range (-20 to -100 kPa) and keep the 25 cm water content flat.

Watching the sensor output carefully, we moved toward optimal irrigation like you see in the fixed drying period regime. Figure 9 shows on July 20th we irrigated just enough to return the soil water potential to the optimal range for the plants while not spiking the 25 cm water content. Thus we weren’t losing water below the root zone. You can even see the daily uptake in water at six cm and 15 cm by those roots in the water content. When we irrigated and returned the tension to the comfort range and didn’t cause the 25 cm water content to increase, that was the optimal high level. We used the 6 cm water content sensor to tell us the full point of irrigation. In this particular soil, you can see it’s about 15% water content.
Conversely, our “empty” point was determined using soil water potential. In September, we let the water go down until the plants didn’t take it up anymore.

In Figure 10, the 25 cm water content is not moving which is great. On Sept. 5th at the six-cm level, the turfgrass stops taking up water (no daily drop). The plants can’t get water out of the soil because the soil water potential is too high. And when water uptake stops, assuming it’s not because of a cloudy day (which it was not), we know it’s the highest level of soil water potential or the “empty” point, where the grass will go into dormancy (-500 kPa). That’s the range we never want to approach. We want to keep the plants in the -20 to -100 kPa comfort range. If it’s dropping below the optimal range, we know it’s time to water.
Something powerful happened when we put these two measurements together (Figure 11). Combining the amount of water in the soil (water content) and the soil water potential allowed us to calculate a water envelope—the amount of water required to go from empty to full—or the maximum amount of water that should be applied to this turfgrass.

Figure 11 illustrates this concept using a full bucket to show the maximum amount of water that should be applied to the soil. Any more than that is just going to run over the “top of the bucket” and be wasted along with fertilizers, etc. The empty bucket (we don’t want to get near this point) is the soil water content corresponding to a tension of -500 kPa in Fig. 10 where the plants can’t get any more water; the associated water content is 8%. The water envelope would be (water content difference) * (rooting depth) or, in this case (16% – 8%) * 0.15 m = 12 mm of irrigation water.
The 12 mm of water would be the maximum amount of water that should be applied to the turfgrass. But, for optimal performance, we’d only want to fall to -100 kPa. In this particular soil, that would be around 12% VWC (volumetric water content) or a change of 4% VWC and irrigation of 6 mm of water. So, in addition to just seeing the comfort range, we can dial up the amount of water we would need to move it from the bottom of the optimal range to the top.
Measuring water potential together with water content for irrigation management saves you time and money. Why? Because it gives you the right information. To return to the cabin analogy, we didn’t know if we would be comfortable in our cabin just by knowing how many logs we added to the fire. In the same way, we won’t know if the soil is at optimal moisture for plant growth just by knowing how much water is there, or the water content. Soil water potential combined with soil water content gives us the precise full and empty points for optimal performance. As the water potential drops outside the crop comfort zone or optimal range, we know we need to add water. And we know exactly how much water to add. These two measurements combined are powerful tools that can be used to perfect water and nutrient management—without losing time and money to issues caused by over-irrigation.
Watch our irrigation management webinars, or Dr. Colin Campbell and Dr. Bryan Hopkin’s recent turf management webinar, or talk to an irrigation expert. Our soil scientists have decades of experience helping researchers and irrigators measure soil moisture to optimize irrigation.
Download the Complete Guide to Soil Moisture
Our scientists have decades of experience helping researchers and growers measure the soil-plant-atmosphere continuum.
Get an in-depth look at the scientific theory, measurement methods, and application of NDVI and PRI.
Everything you need to know about measuring water potential—what it is, why you need it, how to measure it, method comparisons. Plus see it in action using soil moisture release curves.
Everything you need to know about measuring soil moisture—all in one place.
Receive the latest content on a regular basis.

