Master class: Secrets of water in soil
Six short videos—everything you need to know about soil water content and soil water potential—and why you should measure them together.

If you’re running GDD models to know when to act for disease and pest management and your data is not accurate, your predictions can be off by 7-10% or more, impacting both yield and profit.
When you use inaccurate data, the further you are into the growing season, the greater the estimate will differ from reality. For longer season crops, the difference could be quite significant, which is a problem because plant maturity, flowering, and pest/disease GDD targets often have tight windows. The following videos show you how.
Growing Degree Day (GDD or thermal time) predictions save you hours of scouting time and can increase yield because they’re a scientific way to know the best time for insect/disease control measures. Check out this video where Dr. Colin Campbell explains the basic concept of thermal time and shows two different ways to calculate it.
If your temperature measurement is not accurate, your GDD (thermal time) predictions can be off by 7-10%, impacting both yield and profit. The only way to get accurate GDD predictions is to measure temp in your field. Watch this video, where Dr. Colin Campbell explains why.
If you’re getting temperature data for GDD predictions anywhere other than your field location, it could be leading to less than optimal yields and costing you money. Check out this video where Dr. Colin Campbell explains why temperature is variable at different locations.
Infield weather station data and regional weather station data off the internet do not agree. In this video, Dr. Colin Campbell shows what this means for your GDD predictions.
Forget spreadsheets. What if your GDD models could be automated, like this one? With the ATMOS 41 and ZENTRA Cloud data visualization software they can. Check out this video that shows how easy it is to make a GDD model within ZENTRA Cloud.
In this concluding 20-minute webinar, Dr. Colin Campbell weaves all the information together and sums up what you need to know for more accurate models, so you can be confident in your management decisions.
Washington State University runs the Washington State AgWeatherNet. AgWeather Net tier-1 weather stations are concentrated primarily in the agricultural regions of Washington State in apple orchards and other high-dollar crops that (along with California) feed much of the United States.
AgWeatherNet tier-1 weather stations have a measurement suite tailor made for the growers in this particular region. The AgWeatherNet ingests data from these stations and outputs a number of modeled parameters like disease models, pest models, frost prediction, and frost monitoring. These models are extremely valuable for the producers in the region, who actually pay for the system.
What’s interesting about AgWeatherNet is that even though it looks like a dense spatial network, these stations are many kilometers apart. So an accurate tier-1 station sitting in a valley might measure 2 ℃ different than those at an orchard at the top of the hill. This means if they continuously monitor temperature and humidity in the valley and give a prediction for a fungal disease, that prediction will be different from the reality at the top of the hill.
To solve this problem, the AgWeatherNet allows individual growers to purchase and install tier-2 systems.
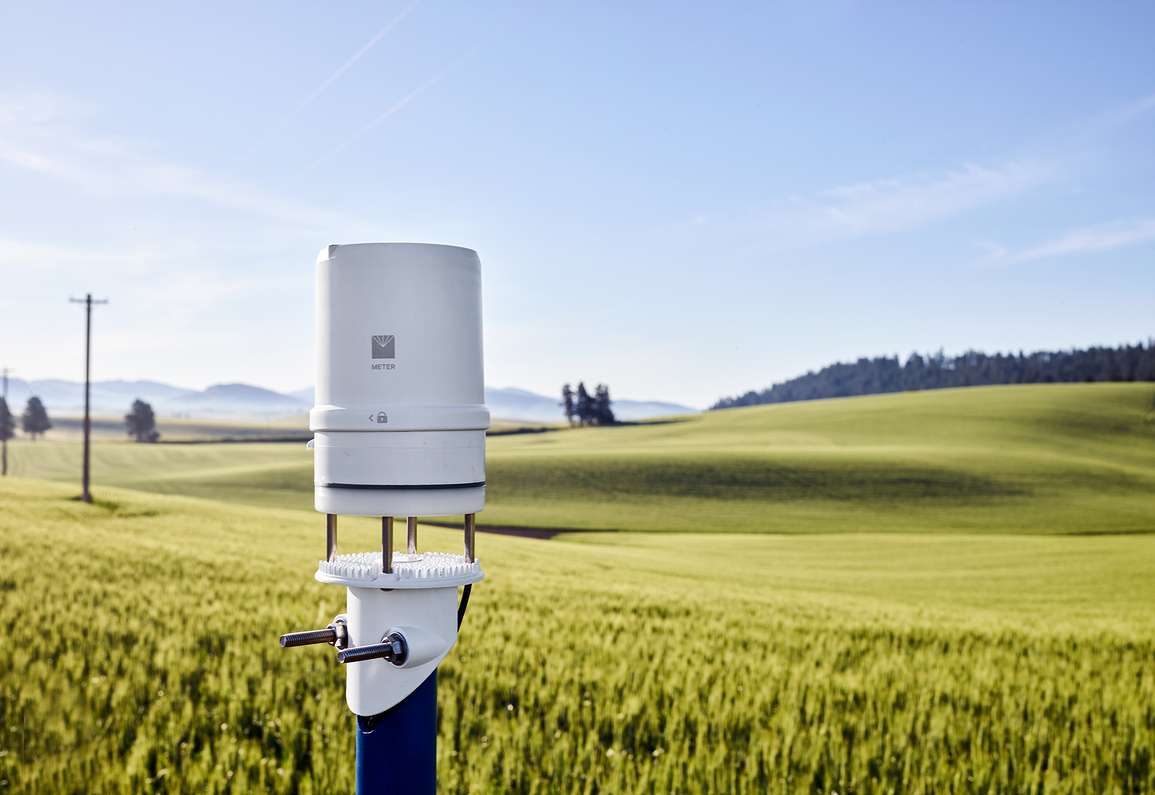
The image below shows an ATMOS 41 all in one weather station used in the AgWeatherNet. It doesn’t have the accuracy specs of the tier-1 stations, but the lack of accuracy at the point scale is almost inconsequential compared to the spatial difference in the weather parameters as you move away from the tier-1 sites. These tier-2 stations fill the gaps in tier-1 observations and AWN can then use artificial intelligence along with these observations to perform hyper-local predictions for the growers who put these stations in. This strategy has been successful at helping to predict mold, pest outbreaks, or frost events at a particular grower’s location. It is easy to see how each weather station type plays a key role in providing stakeholders with critical data for decision making.
The only way to get accurate GDD predictions is to measure temp in your field. We made the ATMOS 41 so you can afford to install a dependable, research-grade weather station in every field for more accurate predictions.
The accurate, affordable ATMOS 41 weather station was designed for continuous deployment in harsh climates, which means there are no moving parts to fail. Setup is incredibly easy, and maintenance has been simplified to the maximum because there’s never any mechanical wear. No oiling or replacing bearings. Just reliability you can continue to count on.
The ATMOS 41 weather station works seamlessly with the ZL6 for simple, plug-and-play data logging and cloud-based data storage and management. You can set up an entire weather monitoring system without any complex wiring or programming.
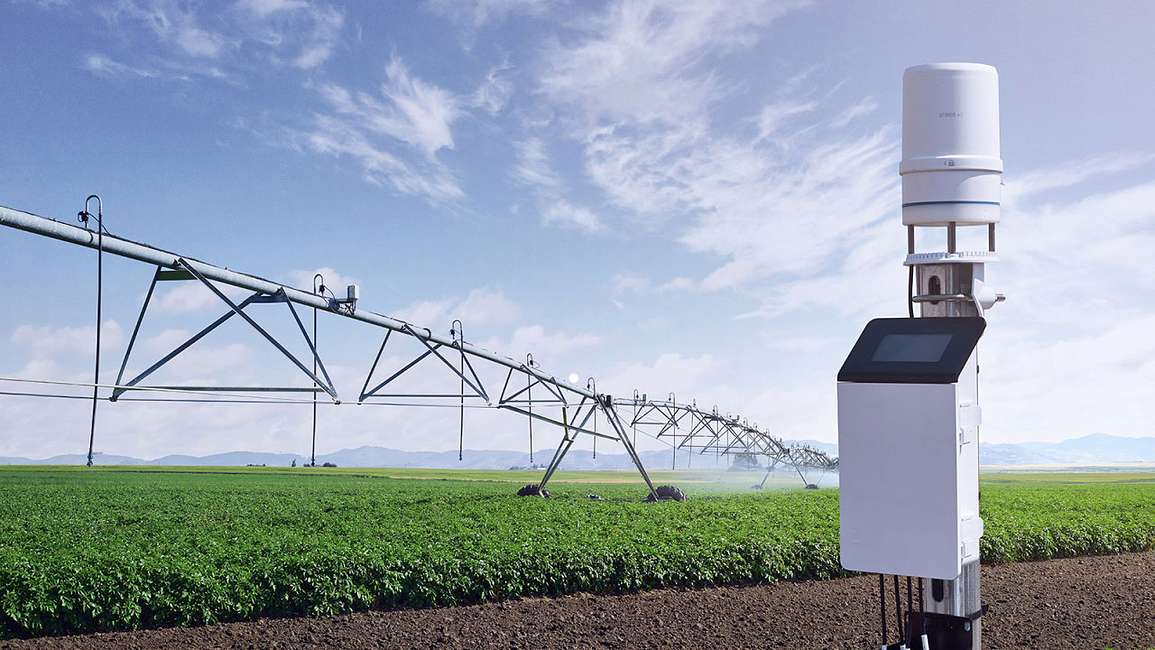
The ZL6 uses ZENTRA CLOUD data visualization software to give you data in near-real-time for rapid decision-making and data-driven management. It even has automated GDD models, so you know exactly when it’s time for scouting or control measures.
ZENTRA Cloud field app allows you to check your data on a smart phone to ensure data matches up with field observations.
Our scientists have decades of experience helping researchers and growers measure the soil-plant-atmosphere continuum.
Six short videos—everything you need to know about soil water content and soil water potential—and why you should measure them together.
Irrigation management simplified. Perfect water and nutrient management without losing time and money to issues caused by over irrigation.
Get an in-depth look at the scientific theory, measurement methods, and application of NDVI and PRI.
Receive the latest content on a regular basis.

