How to measure water potential
Compare current methods for measuring water potential and the pros and cons of each method.

Plant available water is the difference in water content between field capacity and permanent wilting point in soil or growing media. Most crops will experience a yield loss if soil is allowed to dry to the permanent wilting point.
To maximize crop yield, soil water content should be maintained somewhere between field capacity and permanent wilting point. With some basic knowledge about soil type, field capacity and permanent wilting point can be estimated from measurements made by in situ soil moisture sensors. Continuous soil water content data guides irrigation management decisions to increase crop yield and water use efficiency.
Field capacity is the water content of the soil two to three days after a rain or irrigation event when the remainder of water has been removed by the downward forces of gravity. This assumes that the water removed from the soil profile is only removed by gravity, not through the plants or through evaporation. Because of this, field capacity estimates are generally done before the growing season. In the USA and some other countries, the soil is considered to be at field capacity when the water potential (soil suction) in the soil is at -33 kPa.
Field capacity is not the same as saturation. When the soil is saturated, all the spaces between the soil particles are filled with water. When the soil is at field capacity, the spaces between the soil particles contain both air and water. The structure and texture of the soil determines how much water can be held in the soil. Sand, for example, does not hold a lot of water because the large grains do not have a lot of surface area. Therefore, field capacity of a sandy soil can be as low as 10% volumetric water content. Clay particles, on the other hand, are often shaped like upside-down dinner plates randomly stacked on top of one another creating large amounts of surface area. The large surface area and structure of clay soils result in field capacities that can exceed 40% volumetric water content.
Permanent plant wilting occurs when the volumetric water content in the soil is too low for the plant’s roots to extract water. About half of the water in the soil at field capacity is held too tightly to be accessible to plants. The soil is considered to be at permanent wilting point when the water potential in the soil is at or below -1.5 MPa, so the permanent wilting point is the water content of the soil at -1.5 MPa water potential.
Soil at permanent wilting point is not necessarily “dry”. When the water content of a soil is below the permanent wilting point, water is still present in the soil, but plant roots are unable to access it.
Reasonably accurate estimates of field capacity and permanent wilting point can be obtained simply by knowing the texture of the soils that you are working with. If you don’t know how to determine your soil texture watch this quick video.
You can also determine your field capacity value in the field using METER soil moisture sensors. The methodology below is a rough adaptation from Methods of Soil Analysis, Vol. 4 Methodology (Dane and Topp, 2002).
These tests are best done before the growing season as one of the assumptions of this estimate is that water is only being removed from the soil profile through drainage due to gravity.
In a representative part of the field, before the growing season begins, install METER soil moisture sensors at the soil depths where you are interested in determining plant available water. We recommend at least three depths that cover the early and mid growing root zone as well as below the root zone.
Monitor the soil moisture immediately after an irrigation event or a rain event. After three days, in most soils, the water content levels will have stopped changing significantly, suggesting that the remaining water content (assuming no evaporation or transpiration) is considered to be field capacity. In some finer-textured soils, it may be necessary to wait 4 to 10 days for the water content to stop changing significantly.
In Figure 1, soil moisture sensors are installed in silt loam at 0.5 m and 1 m in a vineyard. On 11/13 and 11/17, two significant precipitation events increased the water content at both depths. After the second event on 11/17, you can watch the soil water decrease and then finally flatten out. On about 11/25, the water content levels stop changing quickly, suggesting that removal of water from the soil profile due to gravity has slowed down. Since it is winter time at this location, we can assume that evapotranspiration is minimal.
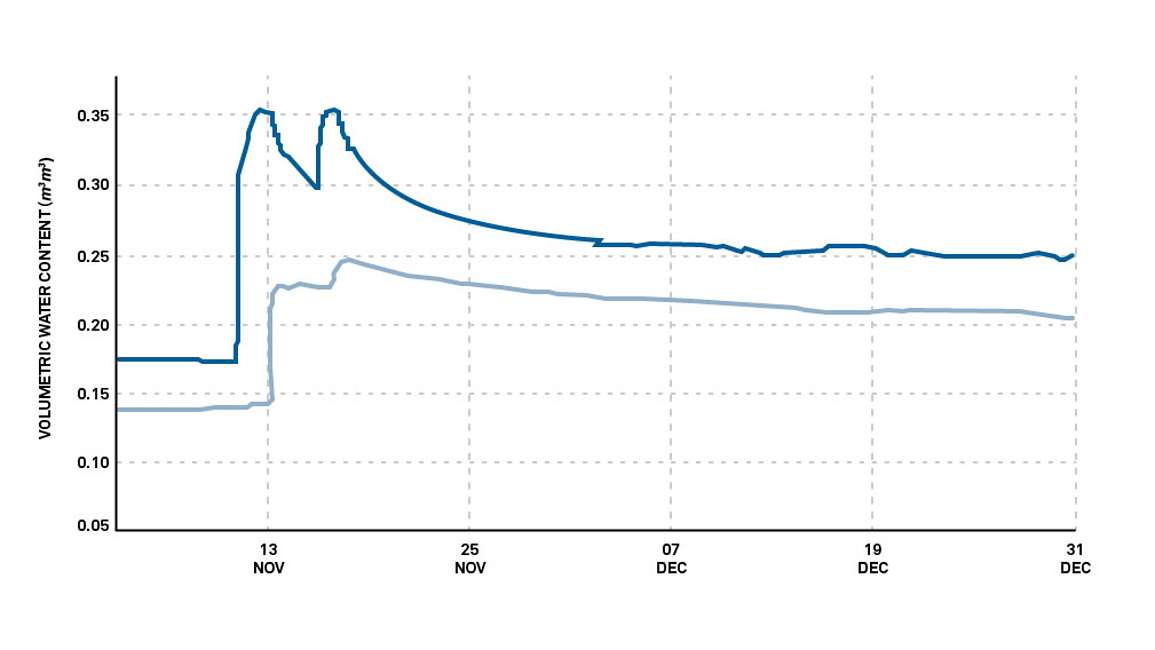
We conclude that the field capacity at 0.5 m is 0.25 m3/m3 and the field capacity at 1 m is 0.20 m3/m3.
In Figure 2, soil moisture sensors are installed in sand at 15 cm, 30 cm, 45 cm, and 90 cm depths in an orchard. On 7/28, two large precipitation events increased the water content in the entire soil profile. We will focus on the 45 cm depth sensor, which is in yellow. It took nearly one full day for the water from the storm to reach the 45 cm sensor. So, our peak starts at 7/29 rather than 7/28. You can watch the soil water decrease quickly and then finally flatten out somewhere between 7/30 and 7/31, or two to three days after the major precipitation event suggesting that removal of water from the soil profile due to gravity has slowed down. July is not the best time to determine field capacity, so we cannot make the assumption that evapotranspiration is minimal, but we often forget to do these tests in the spring so this is a realistic example.
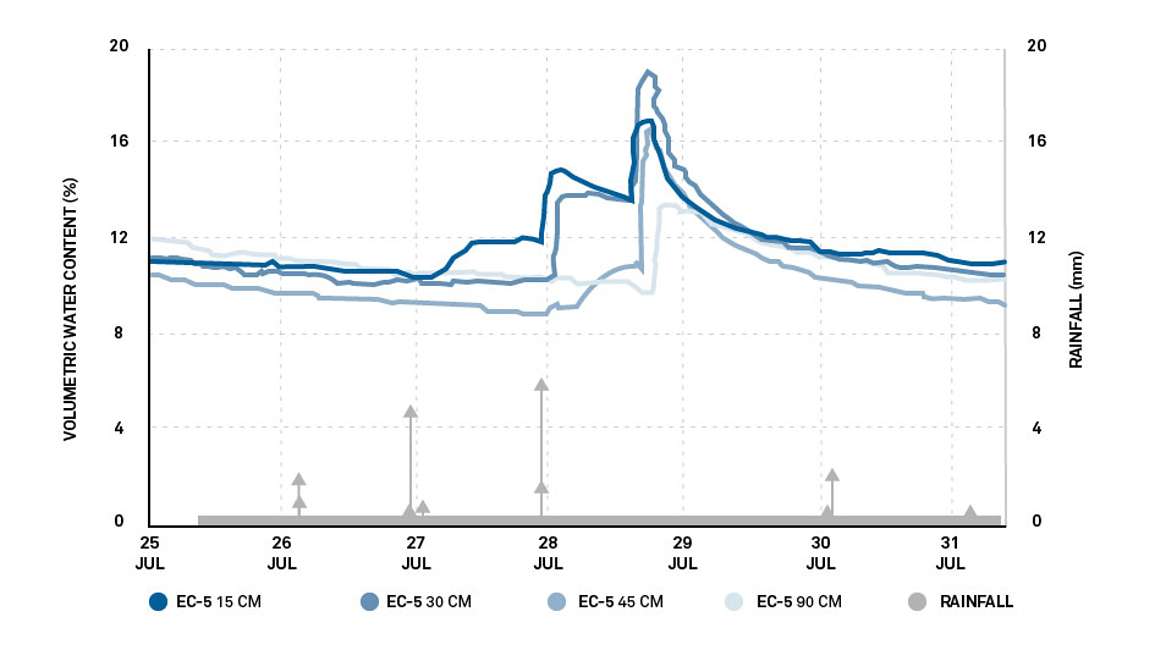
We conclude that the field capacity at 45 cm is 10% VWC.
While field capacity can be easily estimated from the above work, estimating permanent wilting point is somewhat more challenging. Special instrumentation like the WP4C is needed for accurate estimates. For most studies, we recommend either estimating permanent wilting point from soil texture or using a WP4C for determining permanent wilting point (see how). If you do not have access to a WP4C, METER soil moisture release curve construction services can determine the field capacity and permanent wilting points of your soil for you.
Our scientists have decades of experience helping researchers and growers measure the soil-plant-atmosphere continuum.
Dane J, Topp C. 2002. Methods of soil analysis vol. 4. Madison (WI): Soil Science Society of America, Inc. (Article link)
Watch the webinar below to learn:
Six short videos teach you everything you need to know about soil water content and soil water potential—and why you should measure them together. Plus, master the basics of soil hydraulic conductivity.
Explore questions and ideas with a soil moisture expert. METER scientists have decades of experience helping researchers measure the soil-plant-atmosphere continuum.
Compare current methods for measuring water potential and the pros and cons of each method.
Understand the different components of water potential and how to use them. Water potential is the energy required, per quantity of water, to transport an infinitesimal quantity of water from the sample to a reference pool of pure free water.
Dr. Gaylon Campbell, world-renowned soil physicist, teaches what you need to know for simple models of soil water processes.