Soil moisture sensing—evolved
TEROS sensors are more durable, accurate, easier and faster to install, more consistent, and linked to a powerful, intuitive near-real-time data logging and visualization system.

Both the amount and the availability of water (plant available water) in soil is important to plant roots and soil-dwelling organisms. To describe the amount of water in the soil, we use the term water content. To describe plant available water, we talk of water potential. In thermodynamics, the water content would be referred to as the extensive variable and the water potential as the intensive variable. Both are needed to correctly describe the state of water in soil and plants. In addition to describing the state of water in the soil, it also may be necessary to know how fast water will move in the soil. For this, we need to know the hydraulic conductivity. Other important soil parameters are the total pore space, the drained upper limit for soil water, and the lower limit of available water in a soil. Since these properties vary widely among soils, it would be helpful to establish correlations between these very useful parameters and easily measured properties such as soil texture and bulk density. This paper will present the information needed for simple models of soil water processes.
The amount of water in soil is described as the water content. This can be described on either a mass or a volume basis. The mass-basis water content is the mass of water lost from a soil sample, when it is dried at 105 °C, divided by the mass of the dry soil. This definition is useful for determining the water content in the laboratory but is not particularly useful for describing the amount of water in the field. There, the volume-basis water content is more useful. It is the volume of water held per unit volume of soil. If w is the mass-basis water content and θ is the volume-basis water content, then

where ρb and ρw are the bulk density and the density of water. The bulk density of the soil is the dry soil mass divided by the soil volume. The water density is 1 Mg/m3. In mineral soils, the bulk density typically has a value between 1.1 and 1.7 Mg/m3. The volumetric water content is therefore typically larger than the mass water content. You can think of θ as the fraction of the soil volume taken up by water. The fraction taken up by solids can be computed from the bulk density

where ρs is the density of the soil solids. It typically has a value around 2.65 Mg/m3. The total pore space in the soil is 1 – fs. When the soil is completely saturated with water, its water content is the saturation water content, ρs. It can be calculated from the bulk density as

All water held in soil is not equally available to plants, microbes, and insects. One way to determine plant available water is by measuring water potential. Water potential is the potential energy per unit mass of water. The water in the soil is held by forces of adhesion to the soil matrix, is subject to gravitational attraction, and contains solutes that lower its energy compared to the energy of pure, free water. Living organisms must therefore expend energy to remove water from the soil. The water potential is a measure of the energy per unit mass of water that is required to remove an infinitesimal quantity of water from the soil and transport it to a reference pool of pure, free water. Because energy is usually required to remove water, water potential is usually a negative quantity. For potential energy per unit mass, the units of water potential are J/kg. Energy per unit volume comes out J/m3 , or N/m or Pa. We strongly favor J/kg, but one frequently sees water potential reported in kPa or MPa. One J/kg is numerically almost equal to 1 kPa.
While many factors influence the water potential, the most important in a biological context is usually the matric potential. It arises because of the attraction of the soil matrix for water and is therefore strongly dependent on the properties of the matrix and the amount of water in the matrix. Watch the video to see how it works.
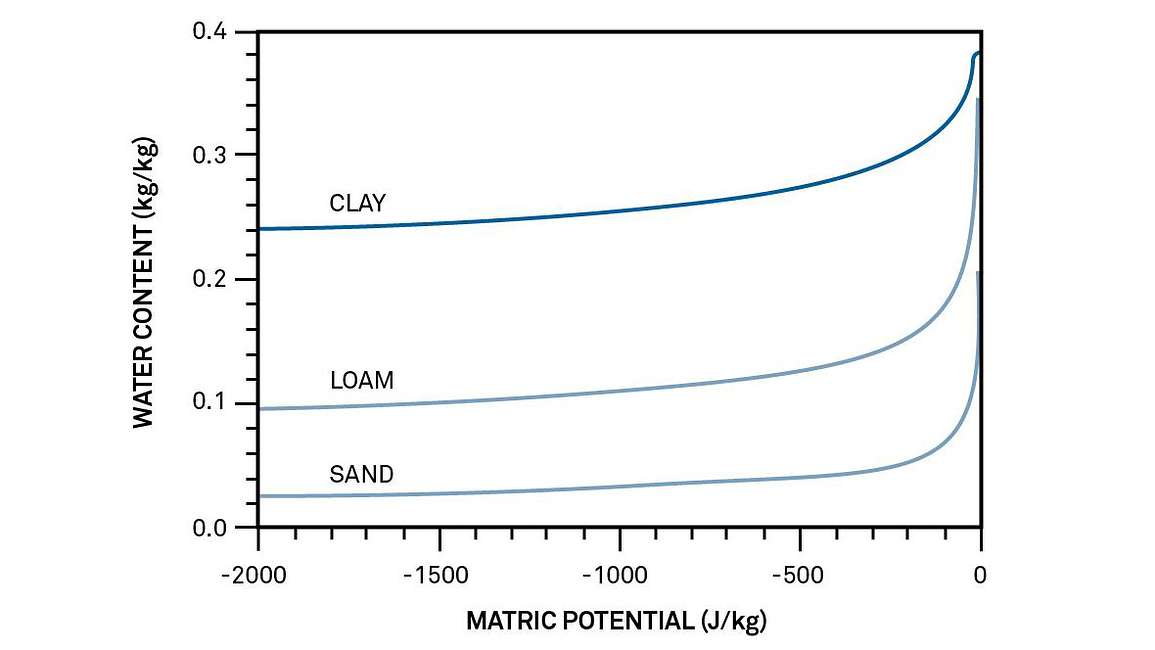
Figure 1 shows typical moisture release curves or moisture characteristics for sand, silt, and clay soils. Clays, because of their smaller pore sizes and greater particle surface areas, lower the water potential more at a given water content than do sands and loam soils. Moisture characteristics like those in Figure 1 are linear when the logarithm of water potential is plotted as a function of the logarithm of water content. The equation describing these curves is

where ψm is matric potential, θ is volumetric water content, ψe is called the air-entry potential of the soil, and b is a constant. The air-entry potential and saturation water content are sometimes combined into a single constant, a, giving

so

The air-entry potential and the b value depend on the texture and structure of the soil. Soil texture can be specified using the name of a textural class, such as silt loam or fine sandy loam, as fractions of sand, silt, and clay, or as a mean particle diameter and a standard deviation of particle diameters. The latter is the most useful for determining hydraulic properties. We will use the bulk density or total pore space as a measure of soil structure.
Shiozawa and Campbell (1991) give the following relationships for converting measurements of silt and clay fractions to geometric mean particle diameter and standard deviation
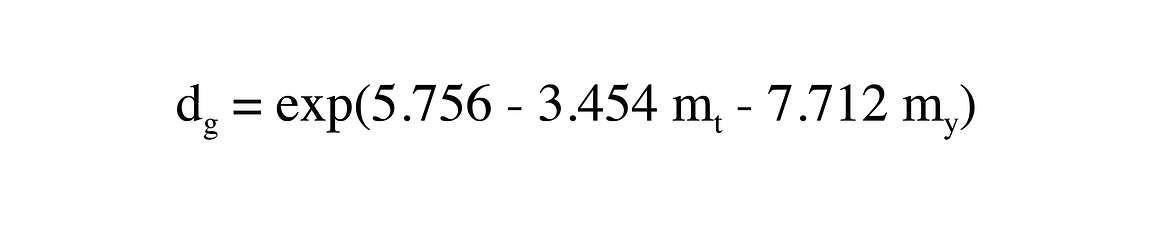
and
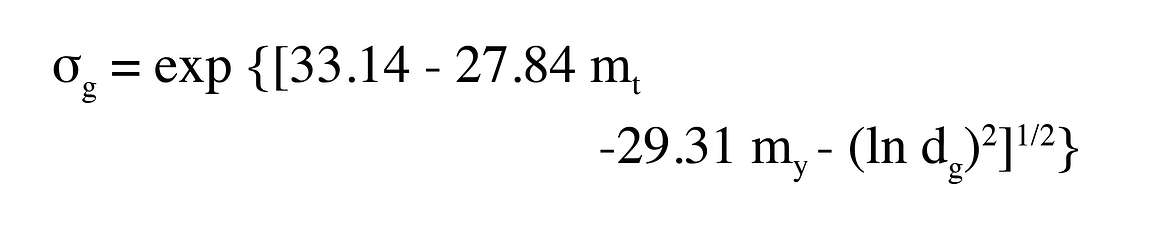
where mt and my are the fractions of silt and clay in the sample, dg is the geometric mean particle diameter in µm, and σg is the geometric standard deviation.
The relationships between hydraulic properties and the soil texture and structure are, at present, quite uncertain, even though a lot of research has been done in this area. The following are equations derived partially from theory and partially by empirically fitting data sets from a number of locations. The dependence of air-entry potential on texture and bulk density can be computed from

where θs is from Equation 3 and dg is from Equation 6.
The exponent, b can be estimated from

Table 1 lists the twelve texture classes of soils and gives the approximate silt and clay fractions for the center of each class. It then shows the values for dg, σg, ψe, and b for each class.
Water moves rapidly through soil at high water content, mainly because of the downward pull of gravity and the high hydraulic conductivity of nearly saturated soil. As water drains from the soil, however, the hydraulic conductivity decreases rapidly, and the rate of movement slows. The downward movement of water under the influence of gravity becomes very small at water potentials between -10 and -33 J/kg. Water at potentials below these values is therefore held within the root zone and is available for plant uptake (plant available water). The water content when the matric potential is between -10 and -33 J/kg (-10 for sands; -33 for clays) is the field capacity water content (θfc), or the drained upper limit. This is the water content one would expect to find if a soil profile were wet by a heavy rain or irrigation, covered, and allowed to stand for two or three days. In other words, it is the highest water content one would typically expect to find in a field soil, except right after water is added.
Values of the water content at -33 J/kg were computed using Equation 4 for each of the textures, assuming ρs = 0.5, and are shown in Table 1.
| Texture | Silt | Clay | dg(μm) | σg | ψe (J/kg) | b | ks (kg s m-3) |
θ-33 (m3m-3) |
θ-1500 (m3m-3) |
θav (m3m-3) |
|---|---|---|---|---|---|---|---|---|---|---|
| Sand | 0.05 | 0.03 | 210.96 | 4.4 | -0.34 | 1.6 | 0.00211 | 0.03 | 0.00 | 0.03 |
| Loamy Sand | 0.12 | 0.07 | 121.68 | 8.7 | -0.45 | 2.7 | 0.001217 | 0.10 | 0.02 | 0.08 |
| Sandy Loam | 0.25 | 0.10 | 61.62 | 12.2 | -0.64 | 3.7 | 0.000616 | 0.17 | 0.06 | 0.11 |
| Sandy Clay Loam | 0.13 | 0.27 | 25.14 | 28.6 | -1.00 | 7.7 | 0.000251 | 0.32 | 0.19 | 0.12 |
| Loam | 0.40 | 0.18 | 19.81 | 16.4 | -1.12 | 5.5 | 0.000198 | 0.27 | 0.14 | 0.14 |
| Sandy Clay | 0.07 | 0.40 | 11.35 | 40 | -1.48 | 11.0 | 0.000113 | 0.38 | 0.27 | 0.11 |
| Silt Loam | 0.65 | 0.15 | 10.53 | 9.6 | -1.54 | 5.0 | 0.000105 | 0.27 | 0.13 | 0.14 |
| Silt | 0.87 | 0.07 | 9.12 | 4.1 | -1.66 | 4.1 | 9.12e-05 | 0.24 | 0.10 | 0.15 |
| Clay Loam | 0.34 | 0.34 | 7.09 | 23.3 | -1.88 | 8.4 | 7.09e-05 | 0.36 | 0.23 | 0.13 |
| Silty Clay Loam | 0.58 | 0.33 | 3.34 | 11.4 | -2.73 | 7.7 | 3.34e-05 | 0.36 | 0.22 | 0.14 |
| Silty Clay | 0.45 | 0.45 | 2.08 | 13.9 | -3.47 | 9.7 | 2.08e-05 | 0.40 | 0.27 | 0.13 |
| Clay | 0.20 | 0.60 | 1.55 | 23.0 | -4.02 | 12.6 | 1.55e-05 | 0.42 | 0.31 | 0.11 |
Note that sands drain to just a few percent moisture at field capacity, while finer-textured soils may have water contents above 0.3 m3m-3. However, all field capacity water contents are well below saturation. The values shown in the table may need to be adjusted to represent what one would find in the field because the bulk density tends to be texture dependent. Sands tend to have high bulk densities (1.6 Mg/m), while finer-textured soils tend to have lower bulk densities. Permanent wilting point (PWP) does not mean that the plant is killed by water potentials in this range. It means that the plant will not recover from wilting unless water is applied. Many species are able to withdraw water from soil to water potentials well below -1500 J/kg, and rapid withdrawal of water from the soil will make water unavailable to a plant that is held at potentials well above -1500 J/kg. The value does, however, provide an approximate lower limit for the water content of soil from which plants are extracting water. Values of θpwp are also shown in Table 1 for θs = 0.5.
Plant available water is defined as the water held in the soil between field capacity and permanent wilting. These values are also shown in Table 1. The values are low for coarse-textured soils but tend to be quite uniform for other soil textures, even though the field capacity and permanent wilting point values vary widely. A note of caution is in order though, in using the values given in the table.
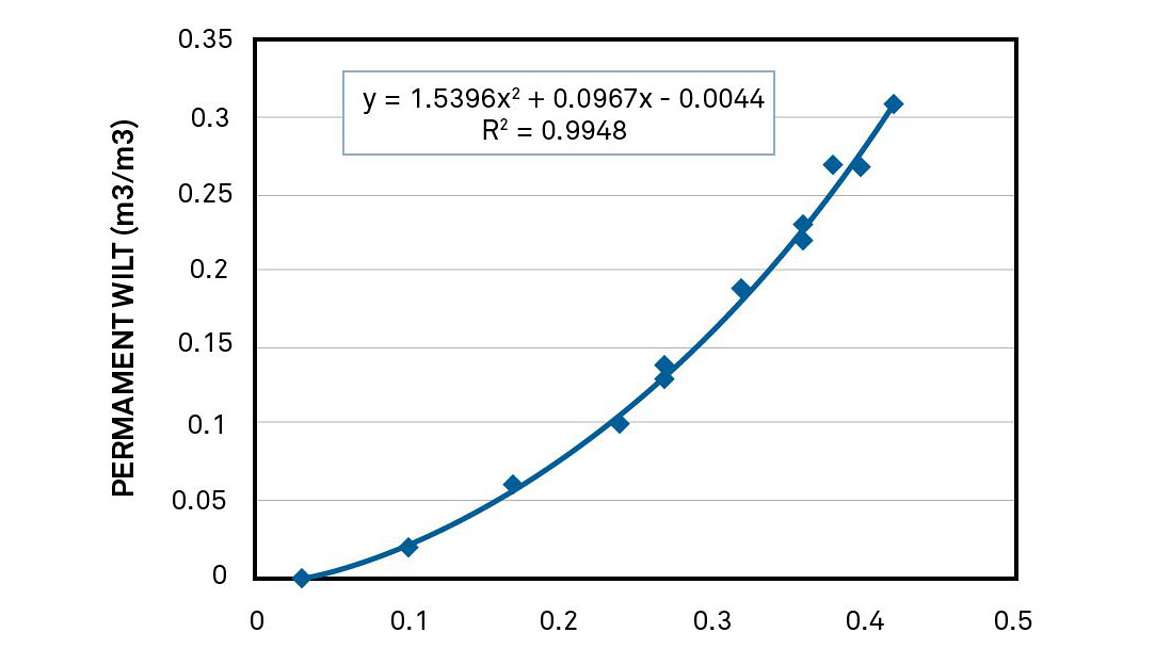
Since both field capacity and permanent wilting point can be computed from basic soil parameters, it stands to reason that they would be correlated. Figure 2 shows the permanent wilt water content for all twelve texture classes plotted as a function of the field capacity water content. The correlation is good, and the data are fit well by a second order polynomial. The practical outcome of this is that one needs only to know one or the other of these variables, and the other can be found from the relationship between the two.
The -33 and -1500 J/kg (1/3 and 15 bar) water contents are often available from soil survey data. If they are known, we can find a and b in Equation 5.5. Taking logarithms of both sides in Equation 5.5, we obtain ln ψm = ln a-b ln θ. Substituting θfc = 33 and θpwp = 1500 and their corresponding water contents (use positive numbers for ψm when you take logs; you can’t take the log of a negative number), you get two equations in two unknowns, b and a, which you can solve simultaneously to get the two parameters


Make sure the values of θfc and θpwp that you use are volumetric water content. Most laboratory data are mass-basis water contents because they are measured using oven drying. If they are mass-basis water contents, convert them to volume-basis water contents using the bulk density and Equation 1 before using them to compute a and b. Sometimes, all one has is an estimate of available water content for a soil. In this case, we can estimate b sufficiently accurately to still find a value for a. Let θav = θfc – θpwp, be the available water content (plant available water) for the soil. We can rearrange Equation 5 to obtain

If we have no other information to indicate the value for b, we will assume a value of 5. This gives a = 637θ5av . Knowing values for a and b, we can use Equation 5 to find θfc and θpwp. An estimate of air-dry water content, which we will need in models of evaporation from soil surfaces, is estimated from

Both water content and water potential can be continuously and easily measured using METER soil sensors. The WP4C measures water potential in the lab and can be used to predict permanent wilting point. METER also provides an array of other field and lab research instrumentation which measure hydraulic conductivity and soil texture. Watch the video to see how our lab instruments work together to characterize soil hydraulic properties.
Our scientists have decades of experience helping researchers and growers measure the soil-plant-atmosphere continuum.
Soil moisture is more than just knowing the amount of water in soil. Learn basic principles you need to know before deciding how to measure it. In this 20-minute webinar, discover:
1. Campbell, Gaylon S. Soil physics with BASIC: transport models for soil-plant systems. Vol. 14. Elsevier, 1985. Book link.
2. Shiozawa, S., and G. S. Campbell. “On the calculation of mean particle diameter and standard deviation from sand, silt, and clay fractions.” Soil Science 152, no. 6 (1991): 427-431. Article link.
Learn everything you need to know about measuring soil moisture—all in one place: why you need it, how to measure it, method/sensor comparisons, how many measurements, where you should measure, best practices, data troubleshooting, and more.
Download the “Researcher’s complete guide to soil moisture”
Six short videos teach you everything you need to know about soil water content and soil water potential—and why you should measure them together. Plus, master the basics of soil hydraulic conductivity.
TEROS sensors are more durable, accurate, easier and faster to install, more consistent, and linked to a powerful, intuitive near-real-time data logging and visualization system.
A comprehensive look at the science behind water potential measurement.
Compare current methods for measuring water potential and the pros and cons of each method.

Receive the latest content on a regular basis.