Soil moisture sensors—How they work. Why some are not research grade
TDR, FDR, capacitance, resistance: A comparison of common soil moisture sensing methods, their pros and cons, and their unique applications.

Soil moisture release curves (also called soil-water characteristic curves or soil water retention curves) are like physical fingerprints, unique to each soil type. Researchers use them to understand and predict the fate of water in a particular soil at a specific moisture condition. Moisture release curves answer critical questions such as: at what moisture content will the soil experience permanent wilt? How long should I irrigate? Or will water drain through the soil quickly or be held in the root zone? They are powerful tools used to predict plant water uptake, deep drainage, runoff, and more.
There is a relationship between water potential (soil suction) and volumetric water content which can be illustrated using a graph. Together, these data create a curve shape called a soil moisture release curve. The shape of a soil moisture release curve is unique to each soil. It is affected by many variables such as soil texture, bulk density, the amount of organic matter, and the actual makeup of the pore structure, and these variables will differ from site to site and from soil to soil.
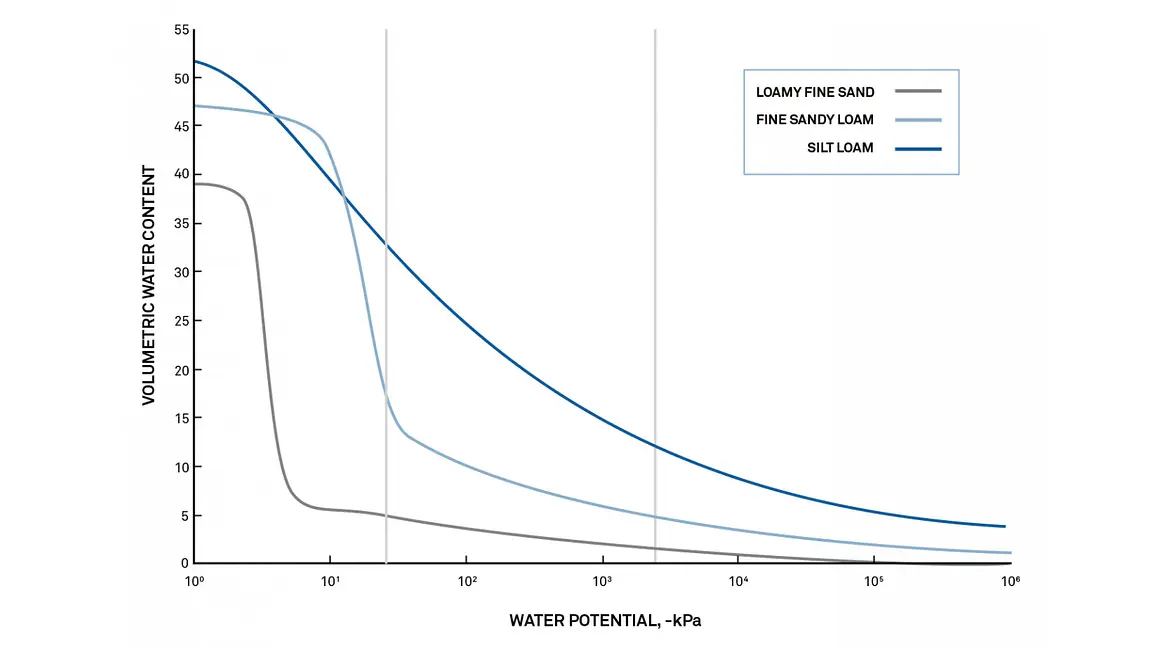
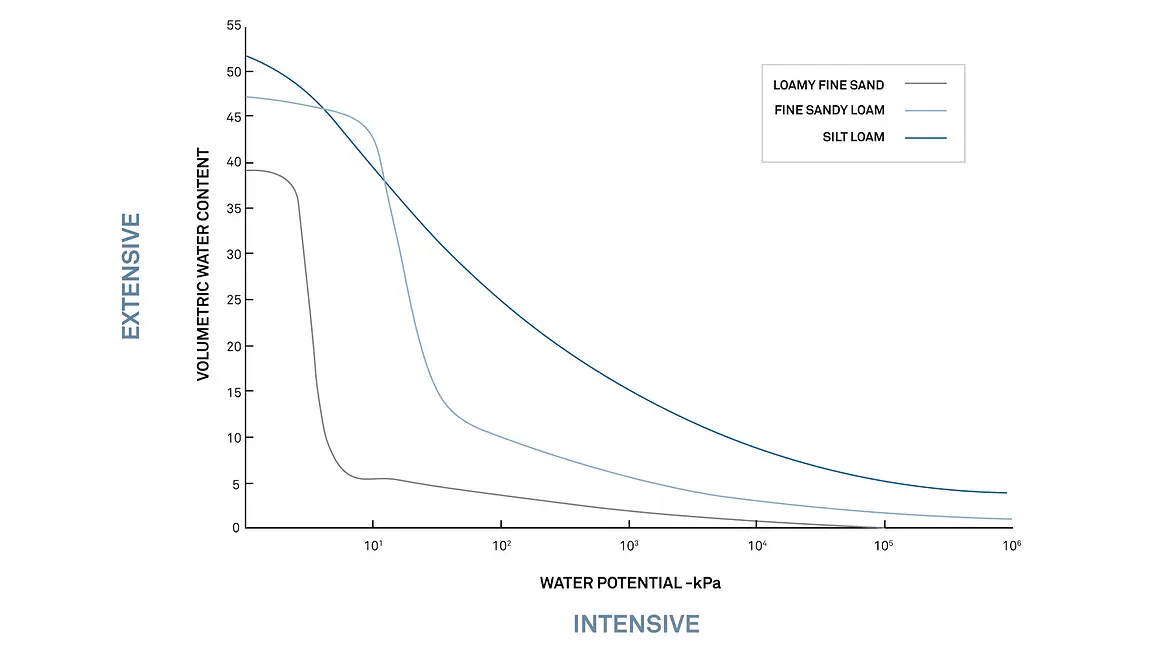
Figure 1 shows example curves for three different soils. On the X-axis is water potential on a logarithmic scale, and on the Y-axis is volumetric water content. This relationship between soil water content and water potential (or soil suction) enables researchers to understand and predict water availability and water movement in a particular soil type. For example, in Figure 1, you can see that the permanent wilting point (right vertical line) will be at different water contents for each soil type. The fine sandy loam will experience permanent wilt at 5% VWC, while the silt loam will experience permanent wilt at almost 15% VWC.
To understand soil moisture release curves, it’s necessary to explain extensive vs. intensive properties. Most people look at soil moisture only in terms of one variable: soil water content. But two types of variables are necessary to describe the state of matter or energy in the environment. An extensive variable describes the extent (or amount) of matter or energy. And the intensive variable describes the intensity (or quality) of matter or energy.
| Extensive Variable | Intensive Variable |
|---|---|
| Volume | Density |
| Water Content | Water potential |
| Heat content | Temperature |
Soil water content is an extensive variable. It describes how much water is in the environment. Soil water potential is an intensive variable. It describes the intensity or quality (and in most cases the availability) of water in the environment. To understand how this works, think of extensive vs. intensive variables in terms of heat. Heat content (an extensive variable) describes how much heat is stored in a room. Temperature (an intensive variable) describes the quality (comfort level) or how your body will perceive the heat in that room.
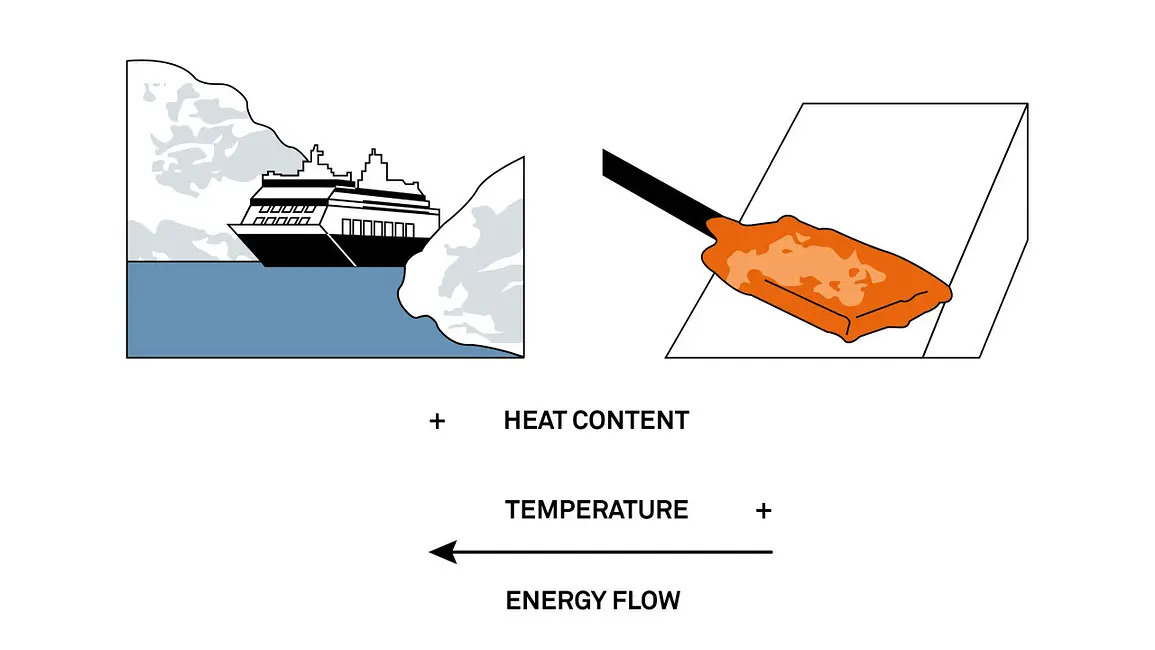
Figure 2 shows a large ship in the arctic vs. a hot rod that’s just been heated in a fire. Which of these two items has a higher heat content? Interestingly, the ship in the arctic has a higher heat content than the hot rod, but it’s the rod that has a higher temperature.
If we put the hot rod in contact with the ship, which variable governs how the energy will flow? The intensive variable, temperature, governs how energy will move. Heat always moves from a high temperature to a low temperature.
Similar to heat, soil water content is just an amount. It won’t tell us how water is going to move or the comfort level of a plant (plant-available water). But soil water potential, the intensive variable, predicts water availability and movement. How?
Plant available water: Water potential measurements clearly indicate plant available water, and unlike water content, there is an easy reference scale—plant optimal runs from about -2-5 kPa which is on the very wet side, to approximately -100 kPa, at the drier end of optimal. Below that, plants will be in deficit, and past -1000 kPa they start to suffer. Depending on the plant, water potentials below -1000 to -2000 kPa cause permanent wilting.
Water movement: Soil water always moves from a high water potential to a low water potential. For example, if a soil’s water potential were -50 kPa, water would move toward the soil layer with a more negative -100 kPa.
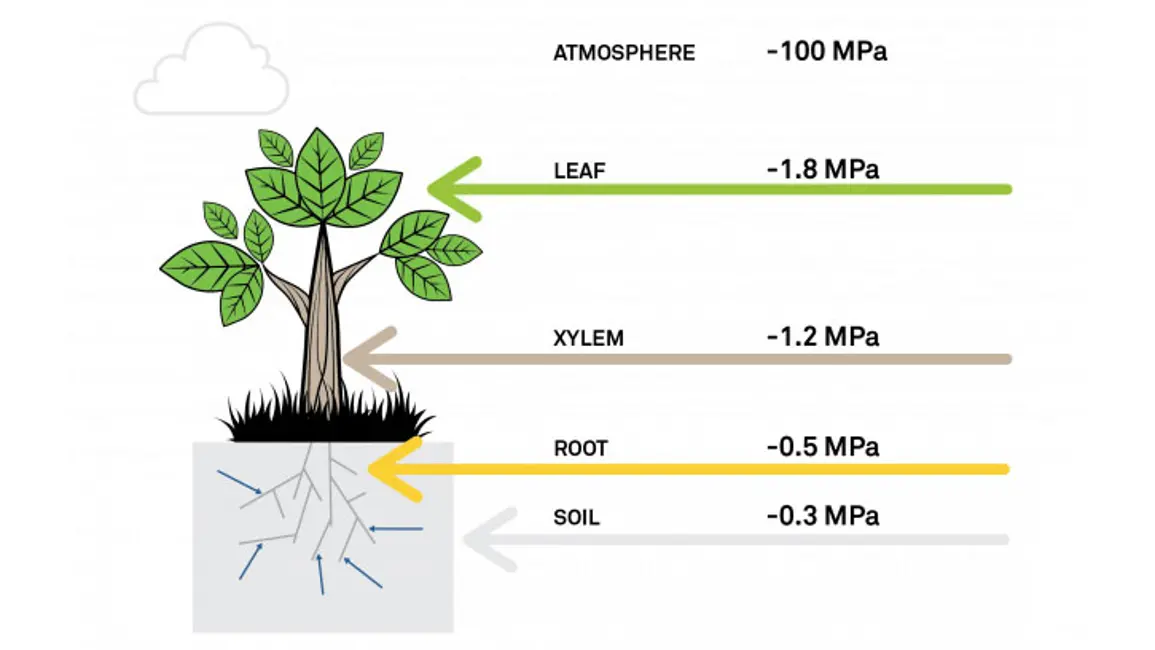
This also approximates what happens in the plant-soil atmosphere continuum. In Figure 4, the soil is at -0.3 MPa and the roots are slightly more negative at -0.5 MPa. This means the roots will pull water up from the soil. Then the water will move up through the xylem, out through the leaves across this potential gradient. The atmosphere, at -100 MPa, is what drives this gradient. So the water potential defines which direction water will move in the system.
Learn more about water content
Download the “Researcher’s complete guide to water potential”
Soil moisture release curves can be made in situ or in the lab. In the field, soil water content and soil water potential are monitored using soil sensors.
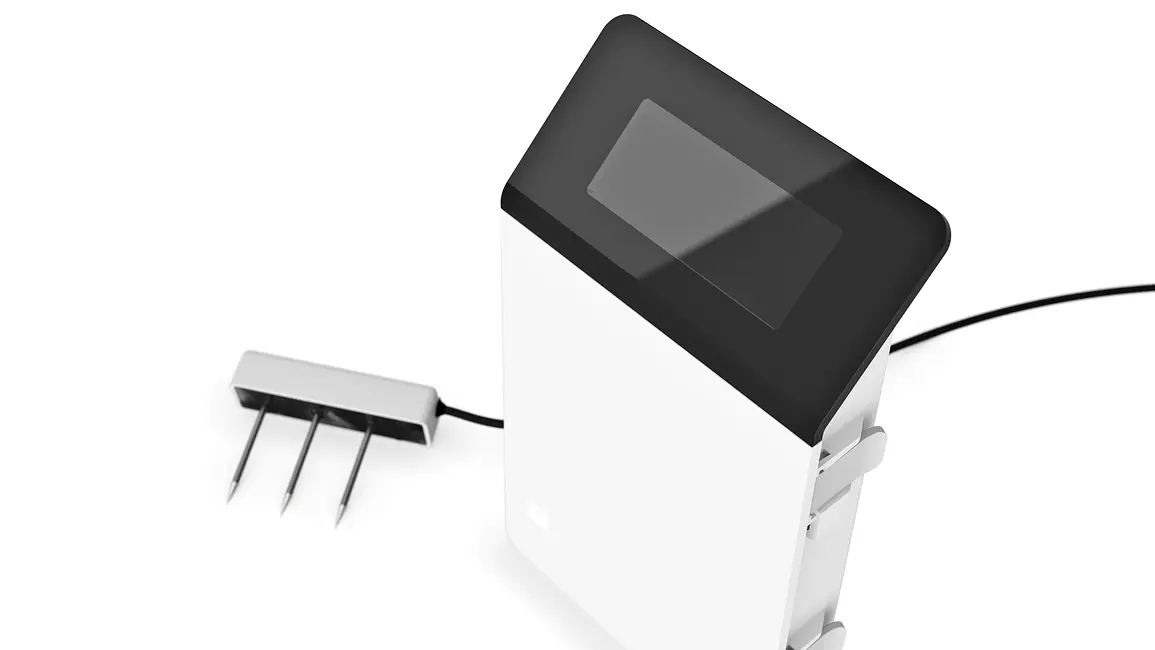
METER’s easy, reliable dielectric sensors report near-real-time soil moisture data directly through the ZL6 data logger to the cloud (ZENTRA Cloud). This saves an enormous amount of work and expense. The TEROS 12 measures water content and is simple to install with the TEROS borehole installation tool. The TEROS 21 is an easy-to-install field water potential sensor, and the TEROS 32 is a low-maintenance tensiometer which also measures water potential.
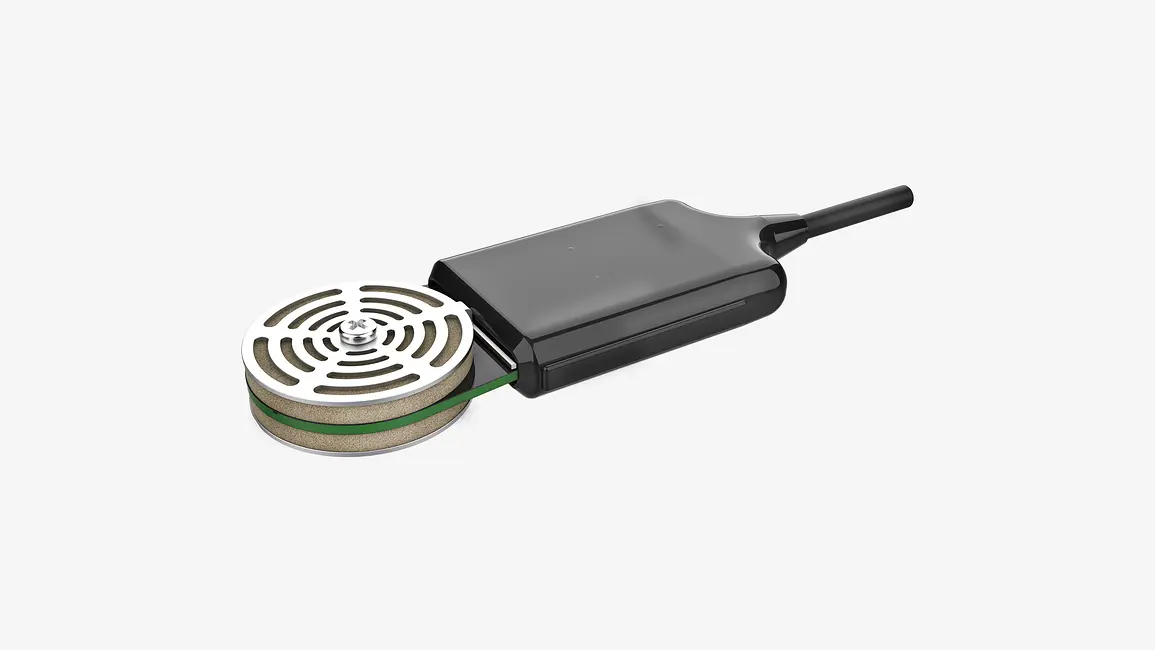
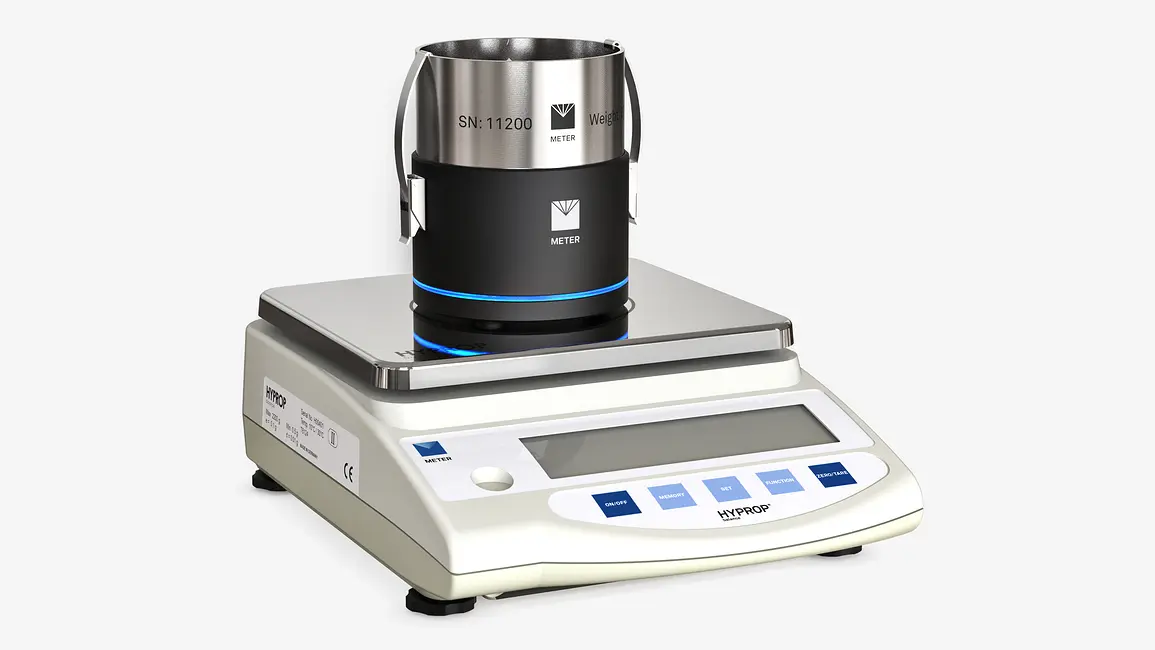
In the lab, you can combine METER’s HYPROP and WP4C to automatically generate complete soil moisture release curves over the entire range of soil moisture.
See how lab and in situ moisture release curves compare
A soil moisture release curve ties together the extensive variable of volumetric water content with the intensive variable of water potential. Graphing the extensive and intensive variables together allows researchers and irrigators to answer critical questions, such as where soil water will move. For example, in Figure 5 below, if the three soils below were different soil horizon layers at 15% water content, the water in the loamy fine sand would begin to move toward the fine sandy loam layer because it has a more negative water potential.
A soil moisture release curve can also be used to make irrigation decisions such as when to turn the water on, and when to turn it off. To do this, researchers or irrigators must understand both volumetric water content (VWC) and water potential. VWC tells the grower how much irrigation to apply. And water potential shows how available that water is to crops and when to stop watering. Here’s how it works.
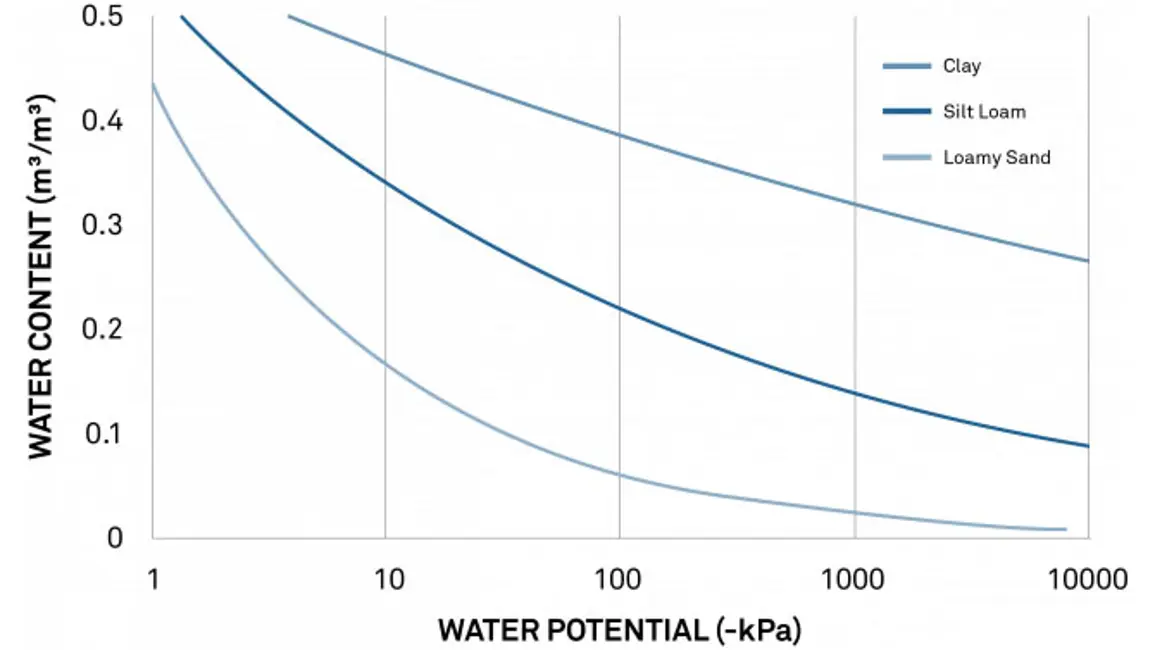
Figure 6 shows typical moisture release curves for a loamy sand, a silt loam, and a clay soil. At -100 kPa, the sandy soil water content is below 10%. But in the silt loam, it’s approximately 25%, and in the clay soil, it’s close to 40%. Field capacity is typically between -10 and -30 kPa. And the permanent wilting point is around -1500 kPa. Soil that is drier than this permanent wilting point wouldn’t supply water to a plant. And water in a soil wetter than field capacity would drain out of the soil. A researcher/irrigator can look at these curves and see where the optimal water content level would be for each type of soil.
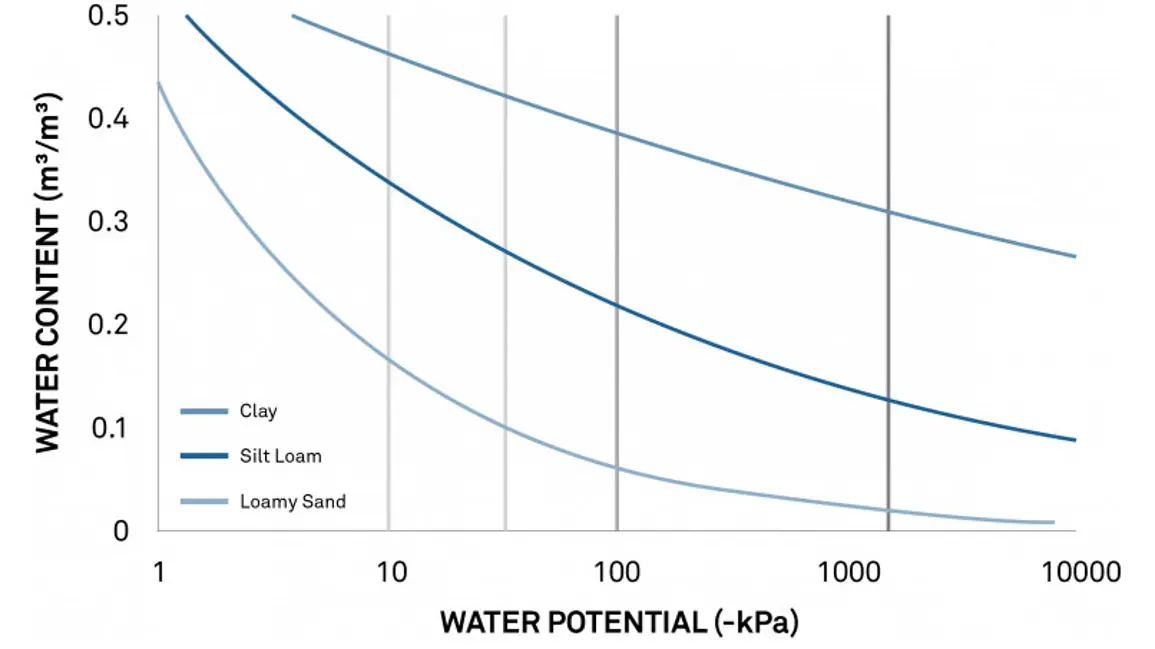
Figure 7 is the same moisture release curve showing the field capacity range (green vertical lines), the lower limit normally set for an irrigated crop (yellow), and the permanent wilting point (red). Using these curves, a researcher/irrigator can see the silt loam water potential should be kept between -10 and -50 kPa. And the water content that corresponds to those water potentials tells the irrigator that the silt loam water content levels must be kept at approximately 32% (0.32 m3/m3). Soil moisture sensors can alert him when he gets above or below this optimal limit.
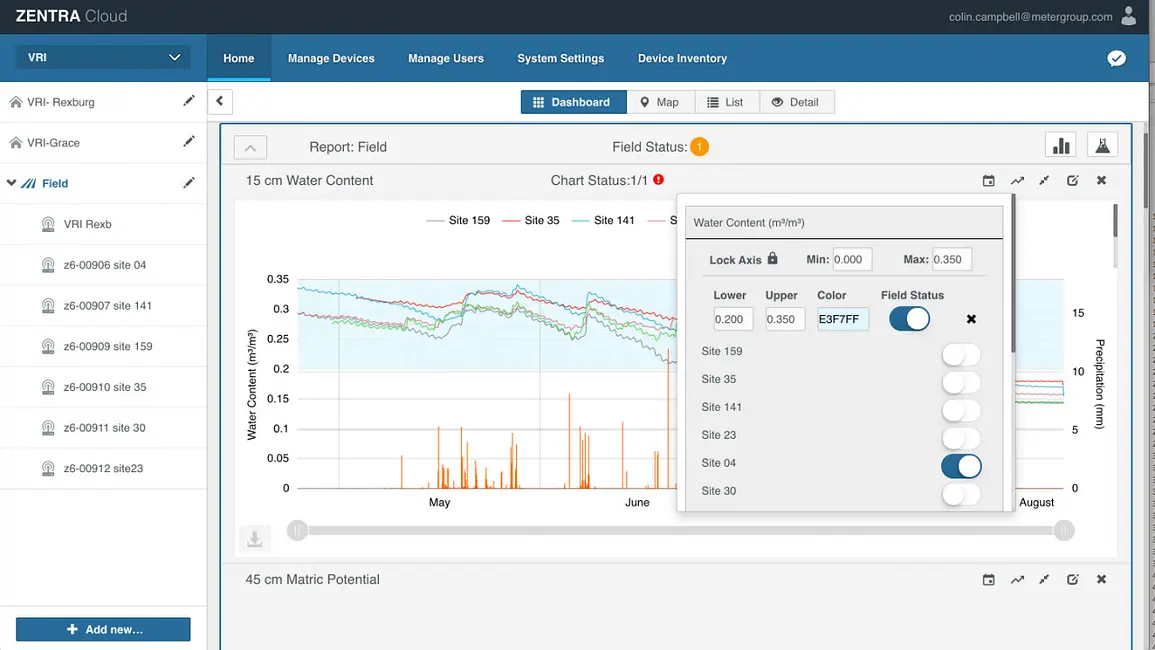
Once information is gleaned from a release curve, METER’s ZL6 data logger and ZENTRA Cloud simplify the process of maintaining an optimal moisture level. Upper and lower limits can be set in ZENTRA cloud, and they show up as a shaded band superimposed over near-real-time soil moisture data (blue shading), making it easy to know when to turn the water on and off. Warnings are even automatically sent out when those limits are approached or exceeded.
Learn more about improving irrigation with soil moisture
15-20 years ago, it took months to get a full, detailed soil moisture release curve in the lab, but we’ve come a long way since then. Why?
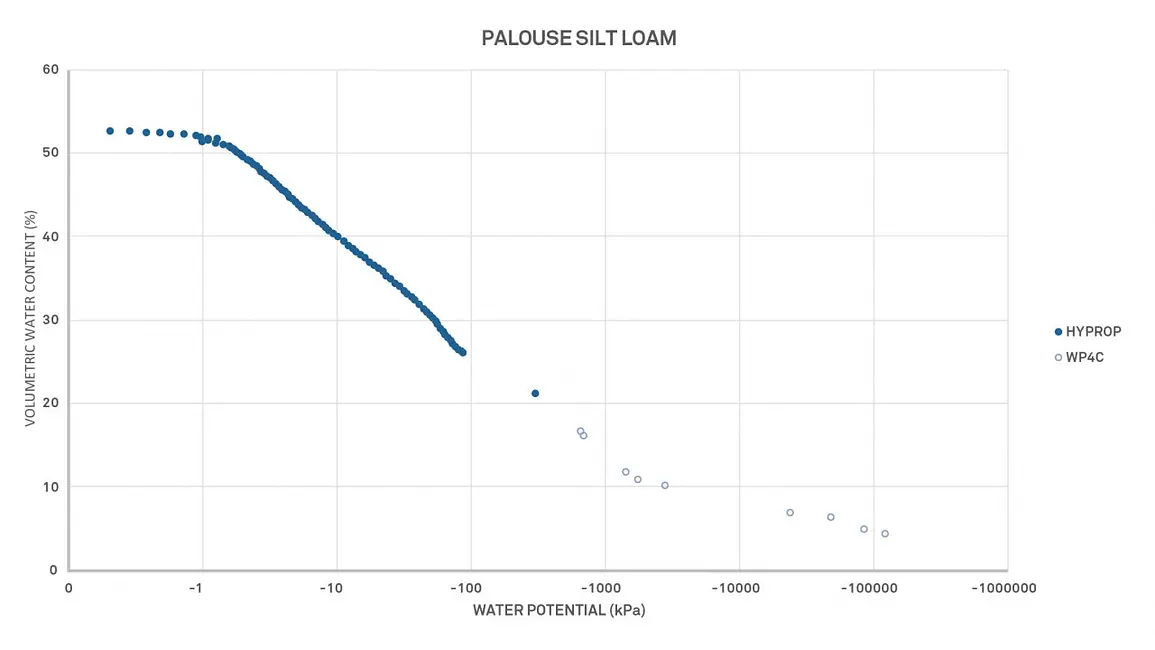
Moisture release curves have always had two weak areas: a span of limited data between 0 and -100 kPa and a gap from -100 kPa to -1000 kPa where no instrument could make accurate measurements. Between 0 and -100 kPa, soil loses half or more of its water content. Using pressure plates to create data points for this section of a moisture release curve meant the curve was based on only five data points.
And then there’s the gap. The lowest tensiometer readings cut out at -0.085 MPa, while historically the highest WP4 water potential meter range barely reached -1 MPa. That left a hole in the curve right in the middle of the plant-available range.
In 2008, METER Group AG in Germany released the HYPROP, an instrument capable of producing over 100 data points in the 0 to -0.1 MPa range. This solved the resolution issue with more than 20 times the data behind that section of the curve.

In 2010, METER Group released the redesigned WP4C water potential meter. Significant accuracy and range gains now allow the WP4C to make good readings all the way up to the tensiometer range. Using HYPROP with the redesigned WP4C, a skilled experimenter can now make complete, high-resolution moisture release curves. For in-depth information about how to make full soil moisture release curves in the lab, see our Moisture Release Curve App Guide.
Colocating water potential sensors and soil moisture sensors in situ add many more moisture release curves to a researcher’s knowledge base. And, since it is primarily the in-place performance of unsaturated soils that is the chief concern to geotechnical engineers and irrigation scientists, adding in situ measurements to lab-produced curves would be ideal.
In the webinar below, Dr. Colin Campbell, METER research scientist, summarizes a recent paper given at the Pan American Conference of Unsaturated Soils. The paper, “Comparing in situ soil water characteristic curves to those generated in the lab” by Campbell et al. (2018), illustrates how well in situ generated SWCCs using the TEROS 21 calibrated matric potential sensor and METER water content sensors compare to those created in the lab.
Soil moisture release curves can provide even more insight and information beyond the scope of this article. Researchers use them to understand many issues like soil shrink-swell capacity, cation exchange capacity, or soil-specific surface area. In the video below, soil moisture expert Leo Rivera gives more detailed information on how to use a moisture release curve to analyze individual soil behaviors with respect to water.
Everything you need to know about measuring soil moisture—all in one place.
Download the researcher’s complete guide to soil moisture
Six short videos teach you everything you need to know about soil water content and soil water potential—and why you should measure them together. Plus, master the basics of soil hydraulic conductivity.
Our scientists have decades of experience helping researchers and growers measure the soil-plant-atmosphere continuum.
TDR, FDR, capacitance, resistance: A comparison of common soil moisture sensing methods, their pros and cons, and their unique applications.
TEROS sensors are more durable, accurate, easier and faster to install, more consistent, and linked to a powerful, intuitive near-real-time data logging and visualization system.
Most people look at soil moisture only in terms of one variable—water content. But two types of variables are required to describe the state of water in the soil.
Receive the latest content on a regular basis.

