Weather monitoring system comparison: Which is right for you?
A comparison of common weather monitoring methods, pros and cons, and which technology might apply to different types of field research.

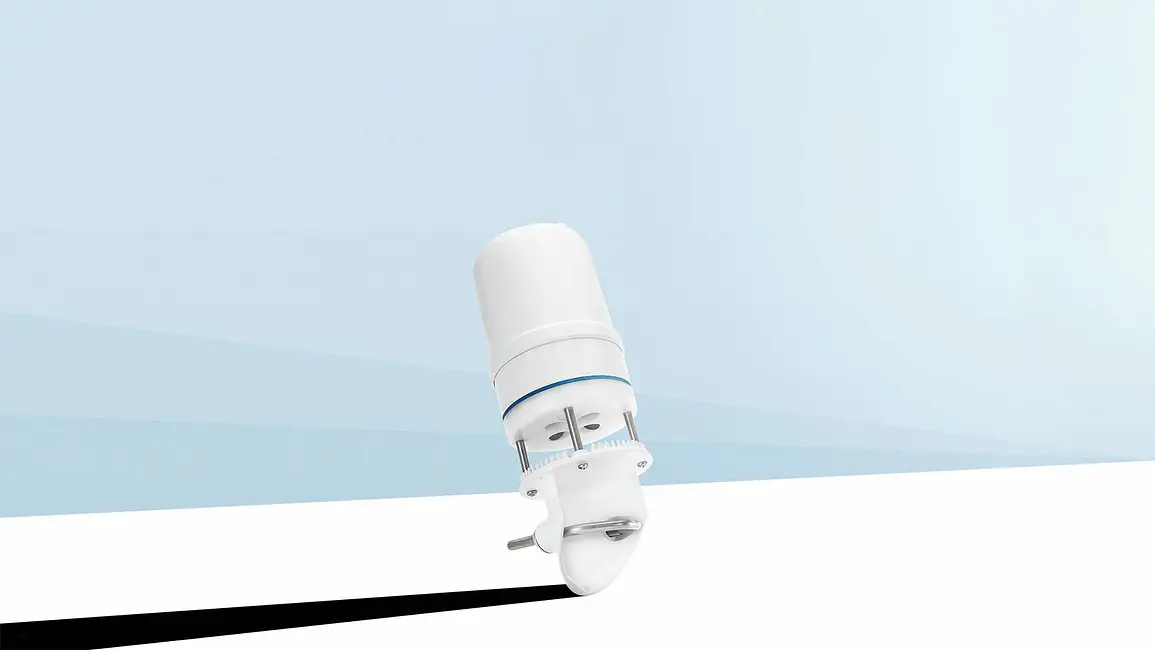
Research-grade weather sensors integrated into remote weather stations and weather monitoring systems measure climate parameters such as precipitation, air temperature, and wind speed. These parameters can change considerably across short distances in the natural environment. However, most weather station observations either sacrifice spatial resolution for scientific accuracy or research-grade accuracy for spatial resolution. The ATMOS 41 all-in-one scientific weather station for researchers represents an optimization of both. It was carefully engineered to maximize accuracy at a price point that allows for spatially distributed observations. Additionally, because many researchers need to avoid frequent maintenance and long setup times, the ATMOS 41 scientific weather station was designed to reduce complexity and withstand long-term deployment in harsh environments. To eliminate breakage, it contains no moving parts, and it only requires recalibration every two years. Since all 14 measurements are combined in a single unit, it can be deployed quickly and with almost no effort. Its only requirement is to be mounted and leveled on top of a pole with an unobstructed view of the sky.
METER released the ATMOS 41 remote weather station in January 2017 after extensive development and testing with partnerships across the world, in Africa, Europe, and the US. We performed comparison testing with high-quality, research-grade non-METER weather sensors and conducted time-series testing for weather sensor-to-sensor variability. Below are the results.
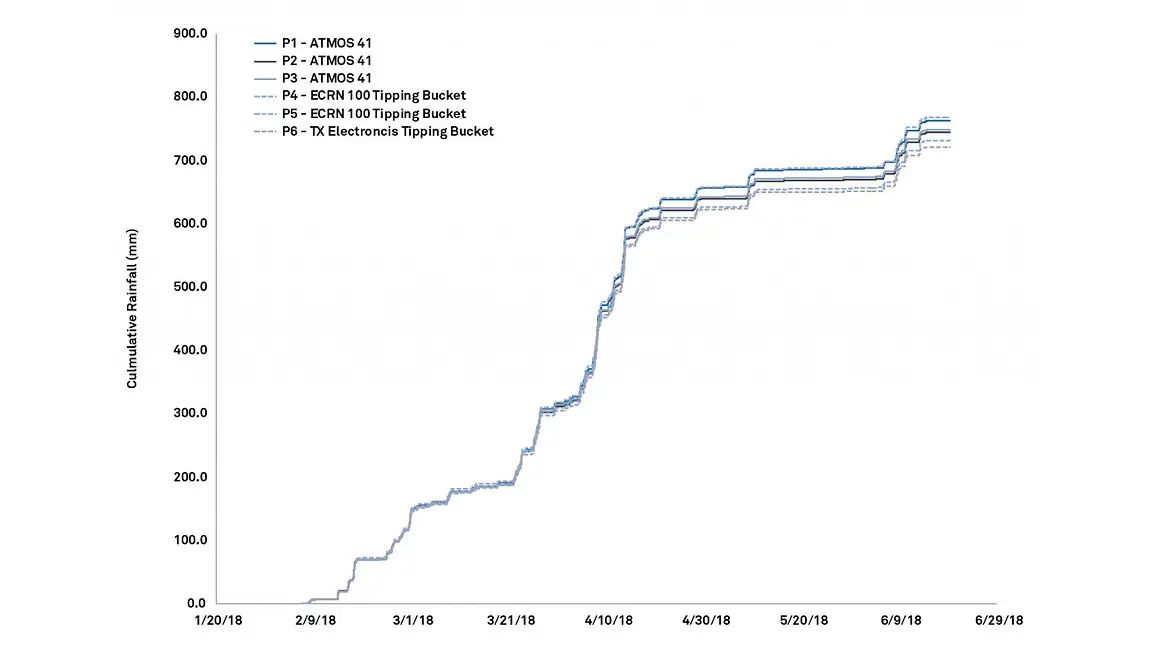
The ATMOS 41 scientific weather station employs the latest technology to improve upon traditional measurement approaches. A key innovation on the ATMOS 41 is the drop-counting rain gauge technology. It uses gold-plated electrodes to detect and count discrete drops from a nozzle precisely engineered to produce a highly repeatable drop size. This no-moving-parts technology is less susceptible to mechanical failure than traditional tipping-spoon gauges. Three tipping-spoon rain gauges (Texas Electronics and ECRN-100) were deployed at our Forks, WA USA precipitation testbed (rainiest location in lower 48 US states) alongside three ATMOS 41 weather sensor suites. All sensors were deployed within two meters of each other spatially at a two-meter height above ground surface. Over four months of data from the winter and spring of 2018 are shown in Figure 1. Interestingly, the three tipping-spoon gauges represent the highest and two lowest accumulated rainfall totals, with all three ATMOS 41 remote weather stations measuring accumulated rainfall totals between the tipping-spoon gauges. Although the scatter in the tipping-spoon gauges makes drawing solid conclusions difficult, all three ATMOS 41 remote weather station units agree within 3% of the average of the tipping-spoon measurements.
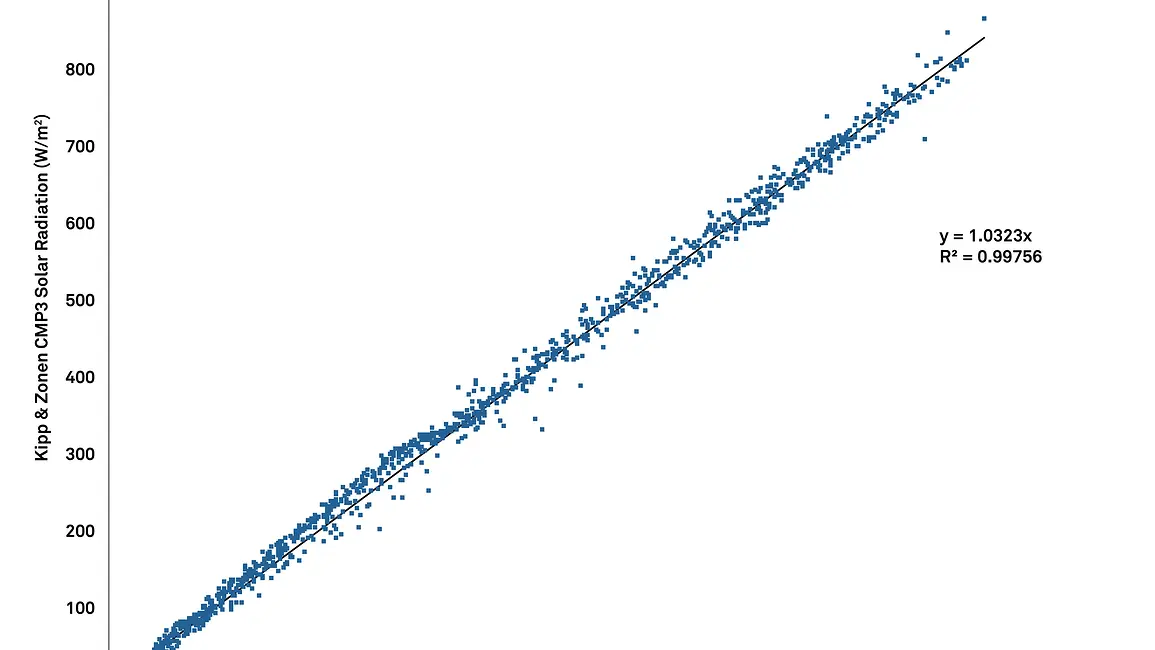
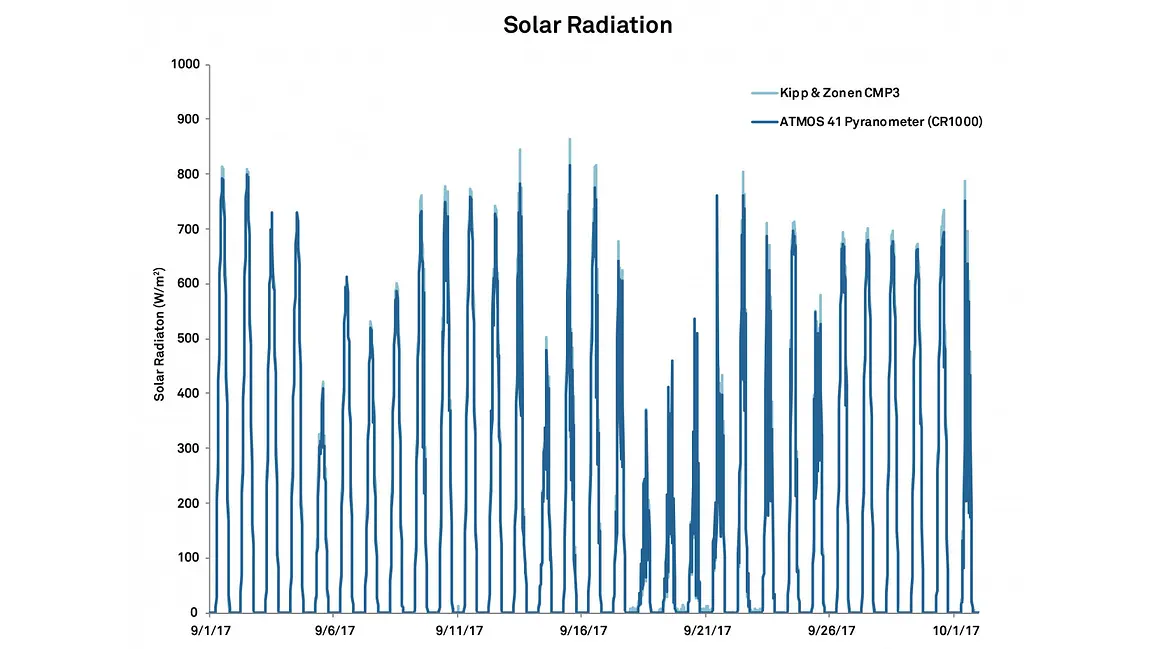
The solar radiation weather sensor comparisons were made on the rooftop testbed at the METER Pullman campus. A Kipp & Zonen CMP3 was co-located with an ATMOS 41 remote weather station for about a month in the fall of 2017. Readings were averaged over a 15-minute period, and the data show good agreement based on the 1:1 plot (Figure 2). A linear regression shows a 3% underestimation by the ATMOS 41 pyranometer.
The ATMOS 41 all-in-one scientific weather station uses a micro thermistor in the anemometer opening and corrects for effects of solar radiation and wind using a basic energy balance approach. Solar radiation and wind speed are combined to adjust air temperature measurement for solar heating and convective cooling instead of the common louvered radiation shield. This method was optimized and verified at the METER Pullman campus using a micro thermistor sensor housed in an Apogee TS-100 aspirated radiation shield as the air temperature standard. The verification results show a 95% confidence interval of +/- 0.6 °C for the ATMOS 41 air temperature measurement (Figure 4), which is significantly better than the error expected for a typical weather sensor housed in a non-aspirated shield. More information on the air temperature correction can be found in our webinar “Stop Hiding Behind a Shield.”
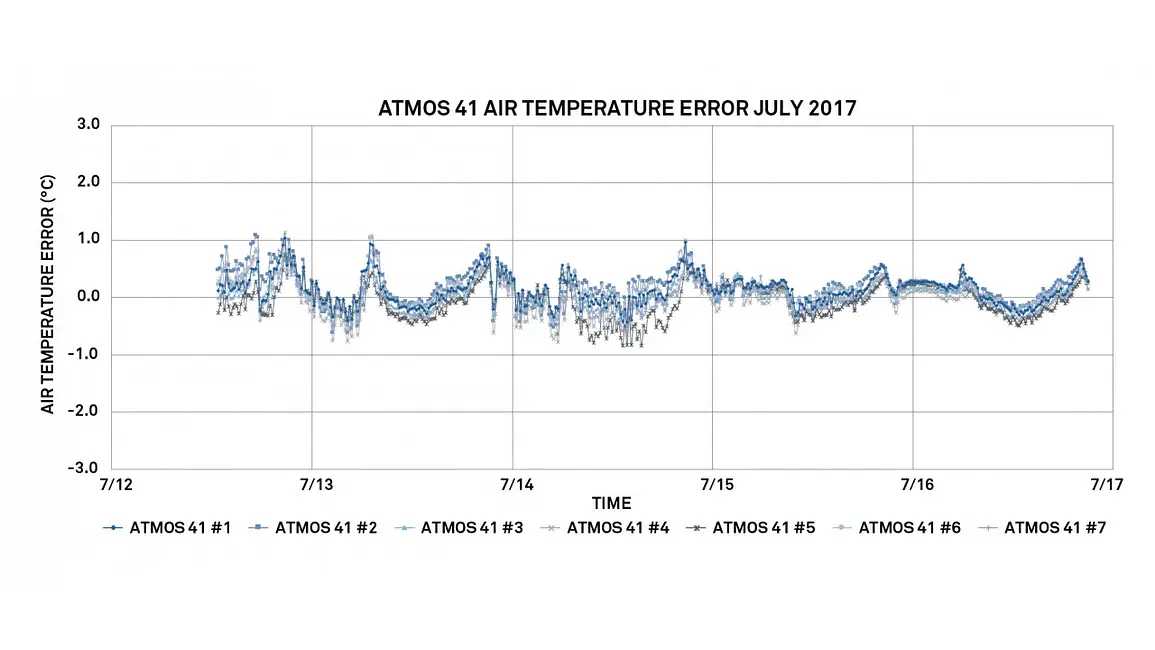
| (All Units are °C) | ATMOS 41 #1 | ATMOS 41 #2 | ATMOS 41 #3 | ATMOS 41 #4 | ATMOS 41 #5 | ATMOS 41 #6 | ATMOS 41 #7 |
|---|---|---|---|---|---|---|---|
| Bias-> | 0.13 | 0.17 | 0.00 | -0.03 | -0.05 | 0.13 | 0.08 |
| 95% Confidence Interval-> | 0.52 | 0.61 | 0.46 | 0.62 | 0.60 | 0.49 | 0.57 |
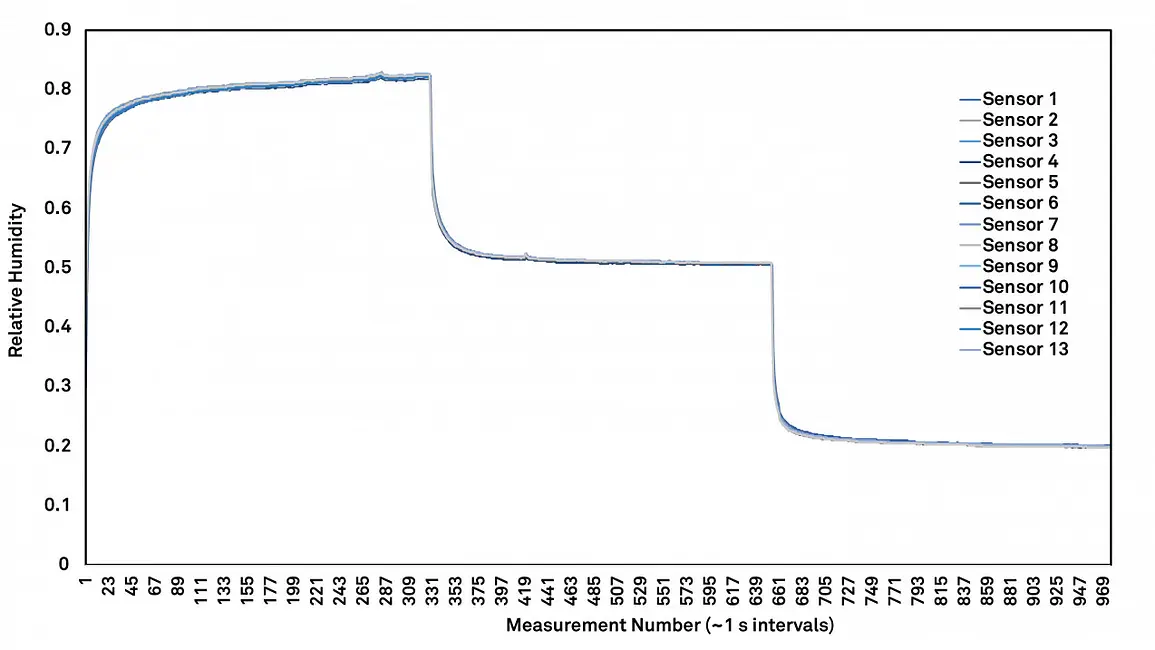
The improved air temperature is used to accurately correct relative humidity. All METER relative humidity sensors are individually calibrated and verified at three humidity levels against a dew point hygrometer standard. Figure 5 shows data consistency between sensors. One to 16 sensors are calibrated at a time and are held to a pass/fail criterion of 2% relative humidity at all three humidity levels. Data show excellent consistency between sensors which are typically calibrated to within 1% of the actual humidity.
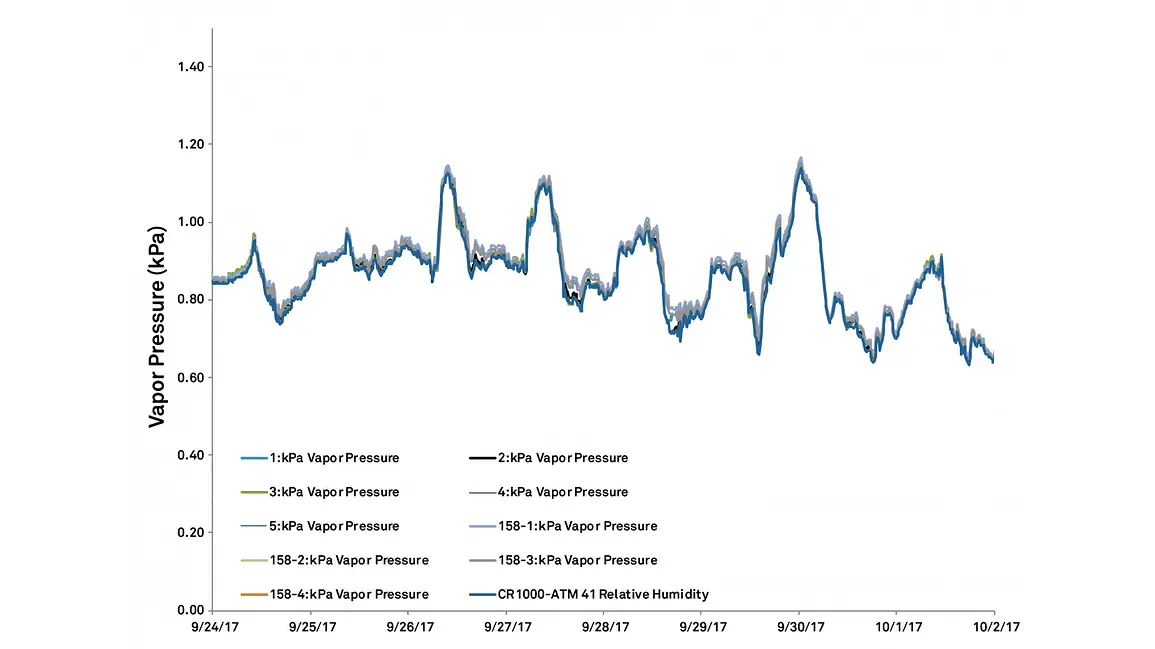
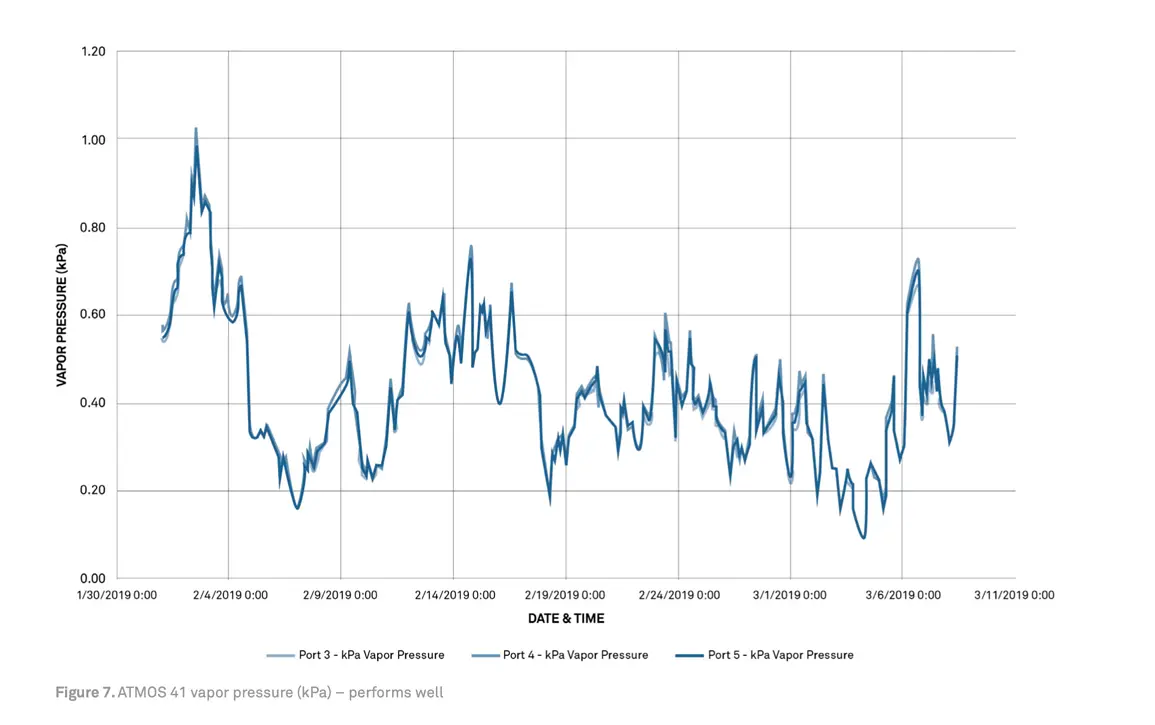
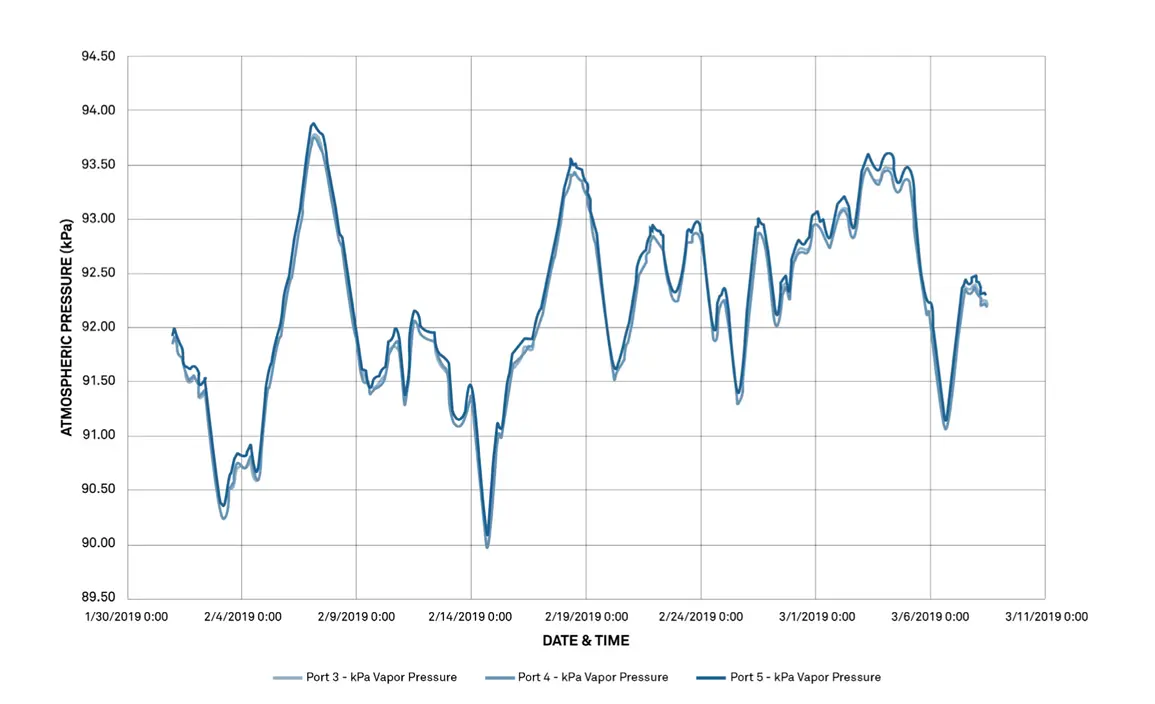
Data collected in the field use the integrated relative humidity and temperature sensor to calculate vapor pressure (kPa). Figure 6 shows sensor performance in the field over an eight-day period and gives an idea of what to expect in terms of consistency between vapor pressure measurements.
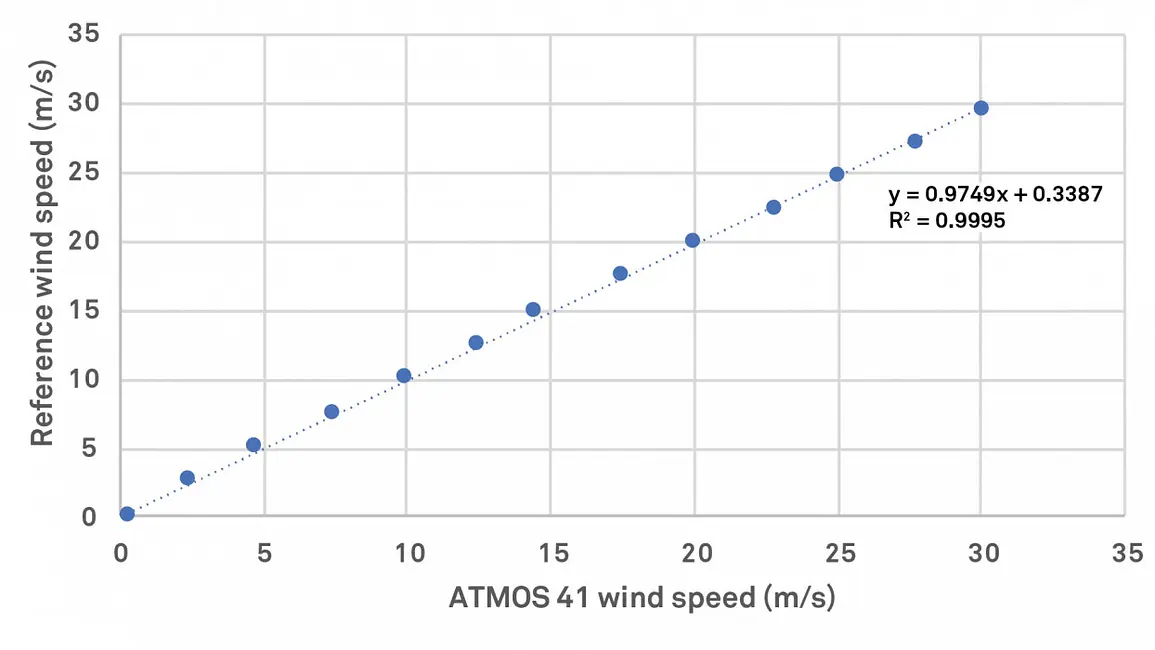
ATMOS 41 remote weather station wind speed and direction weather sensors were tested by a third-party ISO 17025 certified lab. Wind speed is measured by an ultrasonic anemometer with no moving parts as opposed to a cup anemometer. Wind direction is also measured by ultrasonic anemometers since there are two sonic transducers located at 90 degrees apart. The engraved N on the unit must be pointed toward True North to record accurate wind direction. Data are shown in Figure 7 (wind speed) and Table 1 (wind direction).
| Reference Wind Direction (°) | ATMOS 41 Wind Direction (°) | Direction Difference (°) |
|---|---|---|
| 2 | 1.89 | -0.11 |
| 91 | 91.08 | 0.08 |
| 180 | 179.65 | -0.35 |
| 270 | 270.23 | 0.23 |
Table 1. Wind direction data, average of 3 data points
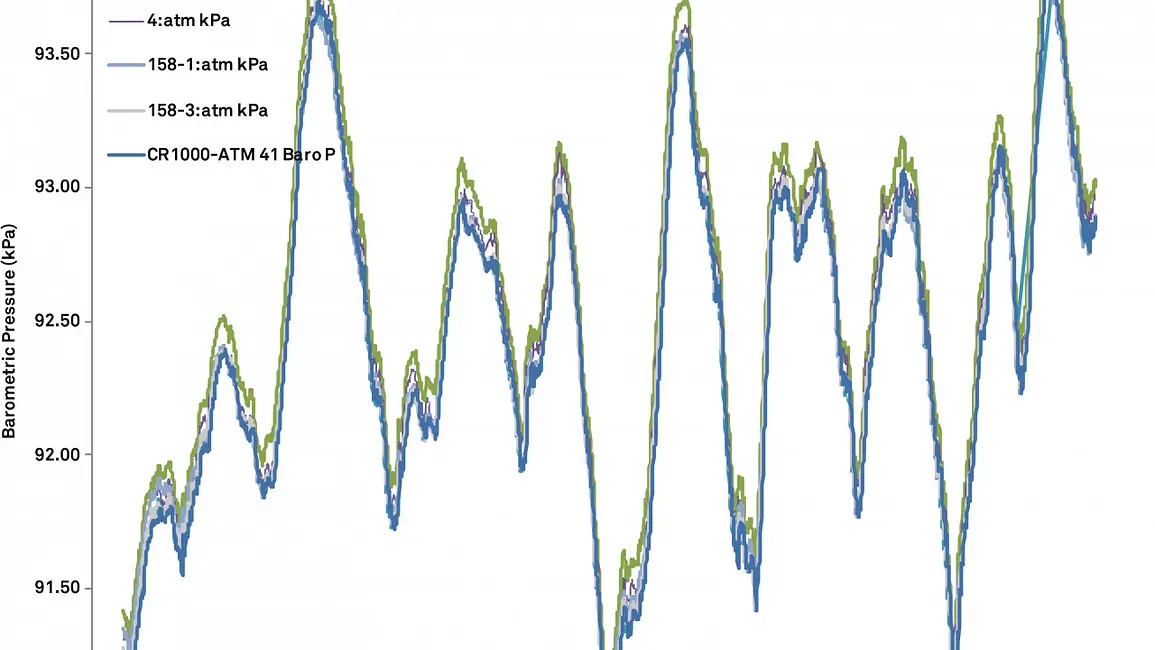
Each ATMOS 41 scientific weather station barometric pressure weather sensor is individually calibrated against a NIST-traceable pressure reference. The difference between the pressure reference and the pressure sensor must be within +/- 0.1 kPa. The difference is then stored on the sensor as an offset. Figure 8 shows the performance of seven ATMOS 41 remote weather stations at the METER testbed. Differences between the top and bottom pressure are around 0.2 kPa.
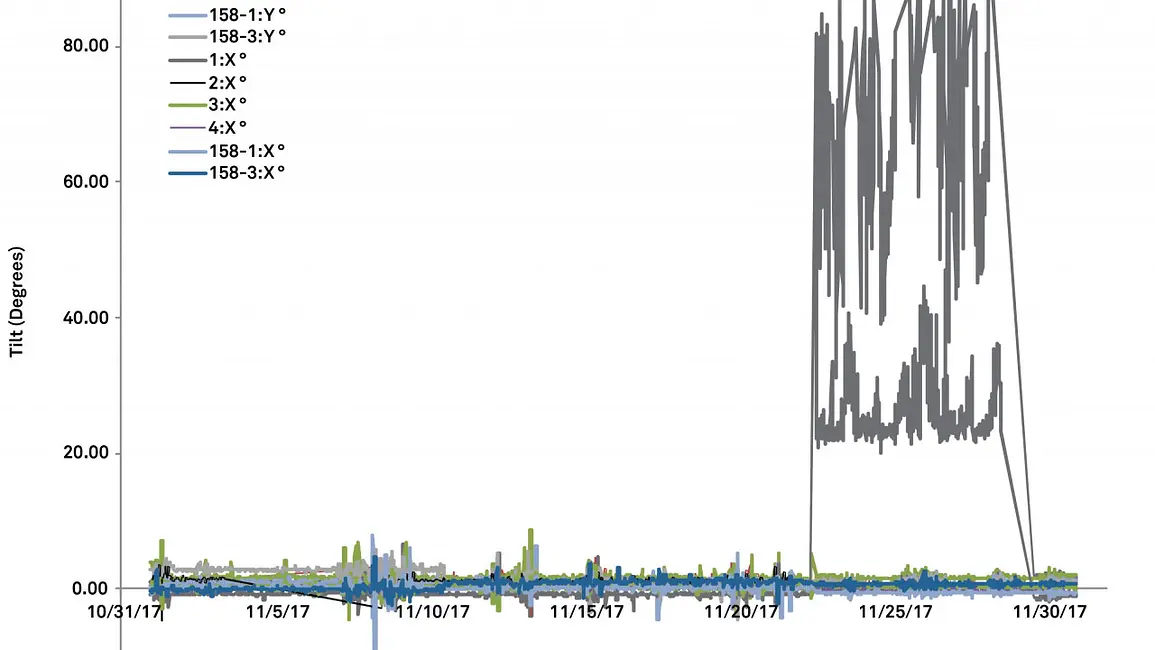
The ATMOS 41 scientific weather station also features a tilt sensor to alert when there’s a problem with level. Tilt sensors are zeroed in the METER production calibration fixture using a bubble level as an indicator. Figure 9 shows the tilt sensor performance using seven ATMOS 41s in the testbed. The blue lines show an example of a sensor that was blown out of level and subsequently discovered and fixed. Each accelerometer showed relatively low noise and high repeatability. It is important to note that occasional episodes of higher noise are a result of high wind speeds and instability in the mounting apparatus and not problems in the sensor.
Data from independent weather sensor comparisons along with side-by-side observations show that the ATMOS 41 weather station meets the goal of research-quality measurements in a simple, robust, and easy-to-maintain unit. Its unique design features such as a no-moving-parts anemometer and drop-counting rain gauge enable long-term, accurate measurements in a harsh environment, and because it’s affordable, it can be relied upon to provide the critical spatially distributed data that will fill the gaps in meteorological measurements. Read on for more details on ATMOS 41 scientific weather station performance.
Our scientists have decades of experience helping researchers and growers measure the soil-plant-atmosphere continuum.
Despite its seeming simplicity, air temperature is one of the most difficult environmental parameters to measure accurately. The current best practice involves housing the air temperature weather sensor in a radiation shield that is either passively ventilated or actively aspirated. Due to design constraints, the air temperature sensor in the new ATMOS 41 all-in-one scientific weather station cannot be fully shielded from solar radiation.
However, since the ATMOS 41 scientific weather station measures wind speed and solar radiation, both of which are primary factors affecting the accuracy of the air temperature measurement, correction is possible.
The air temperature sensor on the new ATMOS 41 remote weather station is partially exposed to solar radiation, which may result in large errors in measured air temperature (Tair).
Uncorrected measurements showed errors ranging to 3 °C when compared to measurements made in a state-of-the-art aspirated radiation shield.
Because the ATMOS 41 also measured wind speed and solar radiation, it was possible to use a simple energy balance calculation to correct the Tair measurement. After correction, error decreased to < 0.5 °C and yielded better accuracy than commonly used passive ventilation radiation shields.
The energy balance of the thermometer has been re-arranged below to correct for errors due to solar radiation.

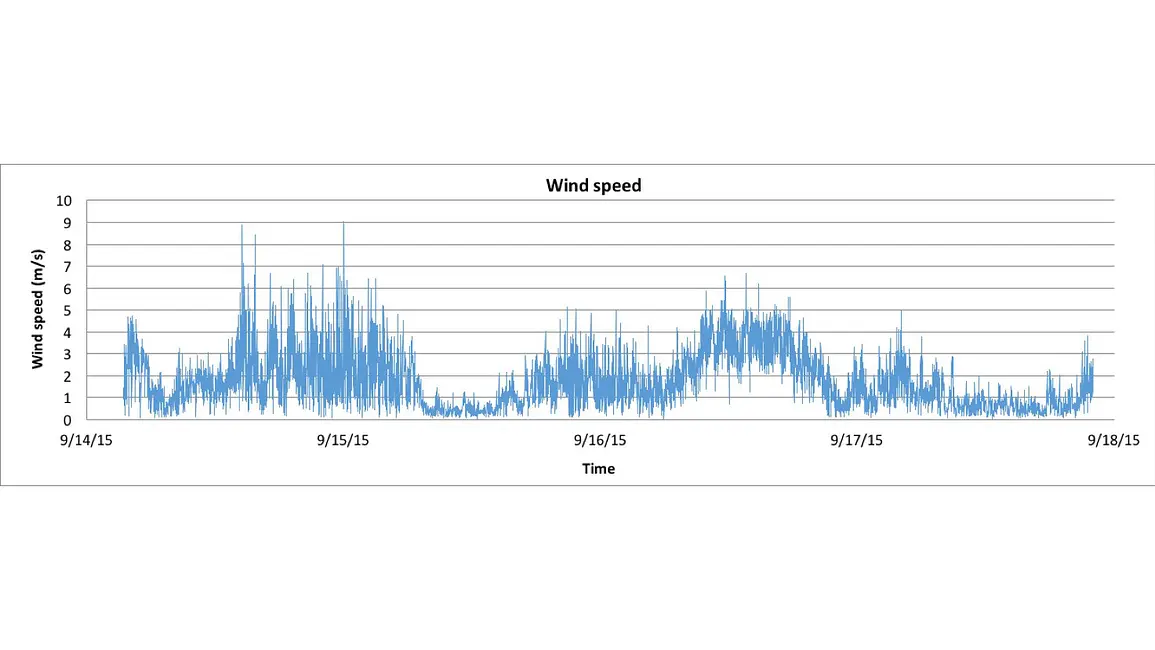
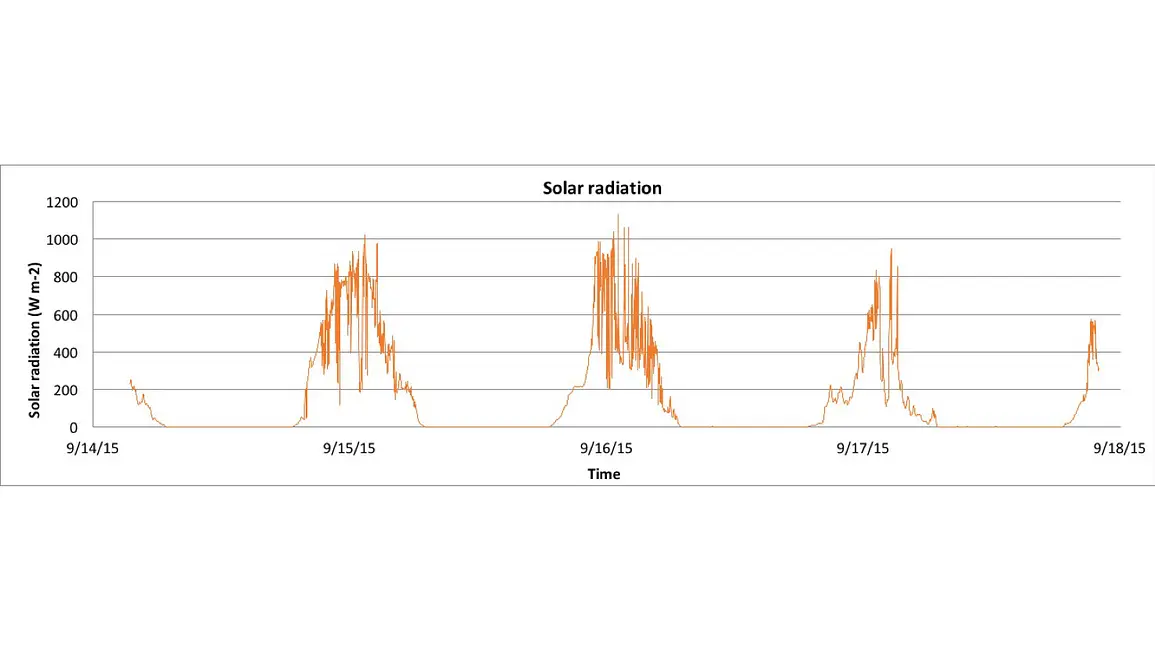
An Apogee TS-100 aspirated air temperature sensor was chosen as the reference standard for Tair. The ATMOS 41 weather station and Davis instruments air temperature sensor in non-aspirated, louvered radiation shield were co-located with the TS-100. A Davis sensor/radiation shield was included to compare ATMOS 41 performance to a typical Tair measurement. Five-minute averaged data was taken over a five day period of variably cloudy conditions in late summer 2015. αs and k from Equation 1 were used as fitting parameters to minimize error in Tair for the ATMOS 41 correction.
The simple energy balance approach worked well to correct air temperature from a partially radiation-exposed sensor.
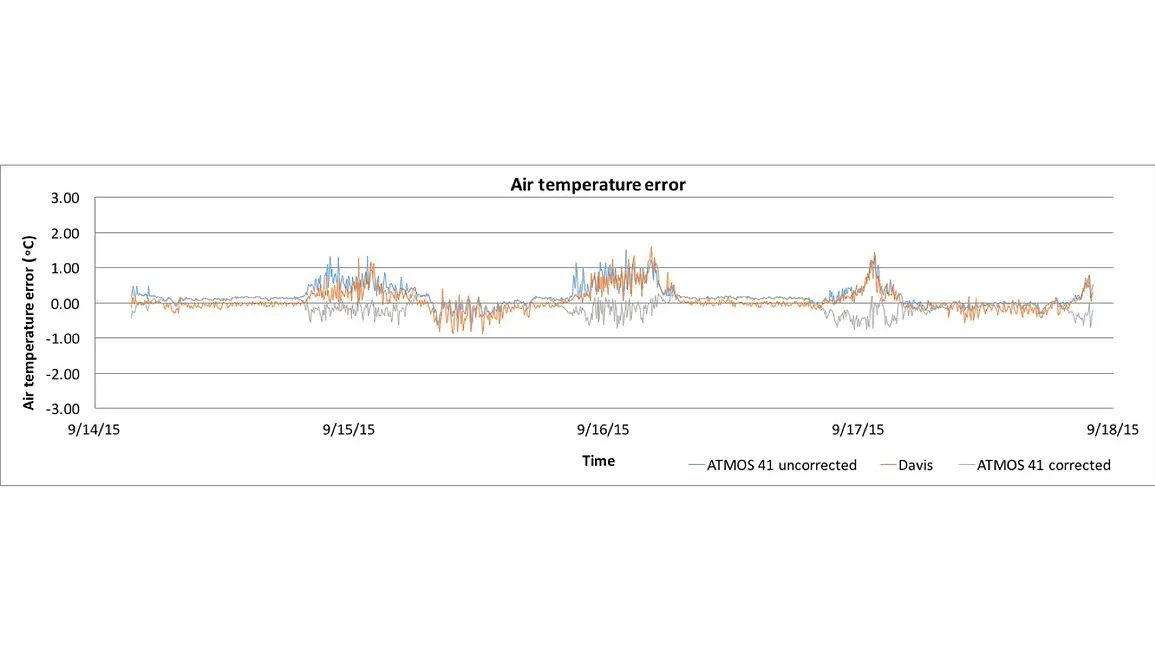
Uncorrected Tair accuracy from ATMOS 41 is comparable to typical non-aspirated radiation shielded air temperature measurement but showed positive bias from solar radiation effects. Radiation-corrected ATMOS 41 outperformed typical radiation-shielded air temperature measurement and yielded 95% confidence interval of well less than ±0.5 °C accuracy.
| (All units °C) | ATMOS 41 uncorrected | Non-aspirated | ATMOS 41 corrected |
|---|---|---|---|
| Average Error (bias) | 0.20 | 0.07 | -0.06 |
| 95% Conf Interval | 0.60 | 0.66 | 0.42 |
| Max Positive Error | 1.51 | 1.58 | 0.36 |
| Max Negative Error | -0.66 | -0.87 | -0.77 |
Table 1. Summary statistics for air temperature measurements for two air temp weather sensors under evaluation
In the video below, Dr. Doug Cobos explains why the ATMOS 41’s radiation-exposed temperature sensor works.
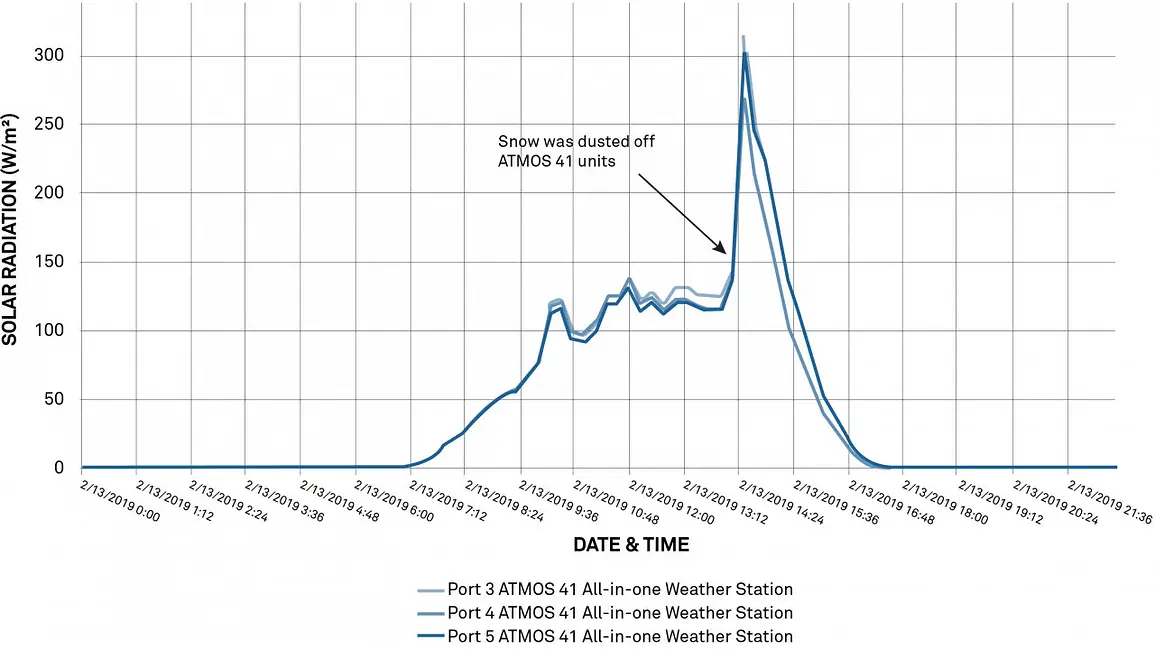
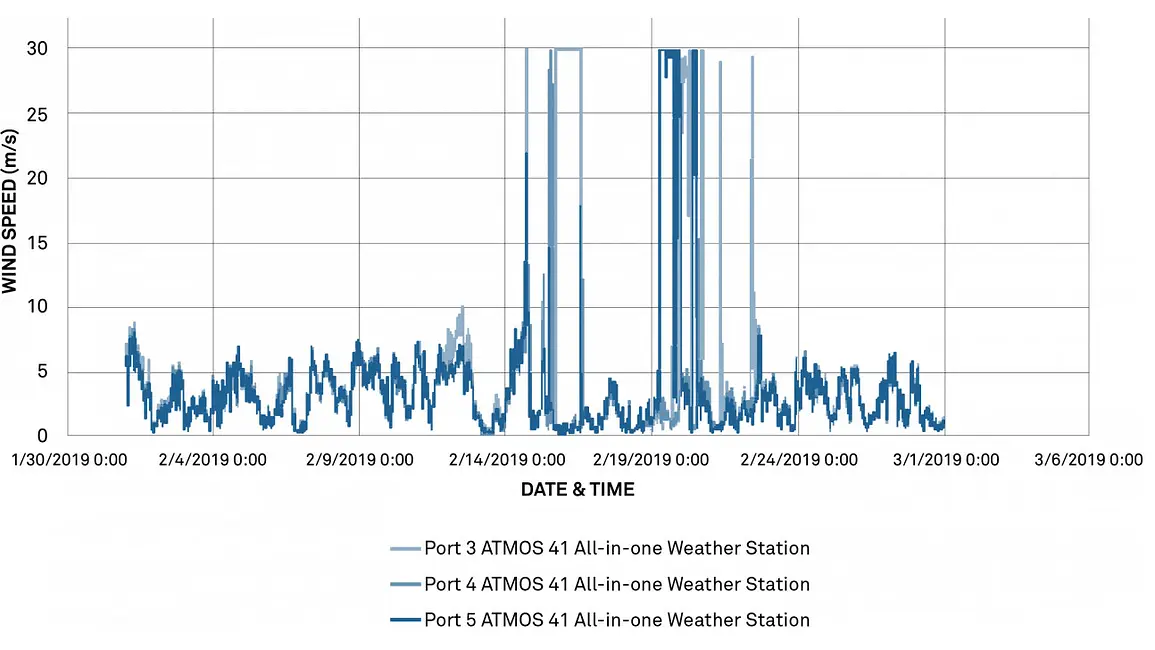
The ATMOS 41 scientific weather station is very durable, even in below-freezing and snowy conditions. There is no need to winterize the weather sensor suite, though we caution users about effects of snow and ice in the anemometer or on top of the pyranometer. There is no heater in the ATMOS 41, so liquid water will only be measured once the ice and snow melt, and snow that might have overflowed the rain gauge funnel will not be accounted for. The air temperature sensor and correction model both perform well. See data below, recorded at METER’s rooftop testbed during winter of 2019.
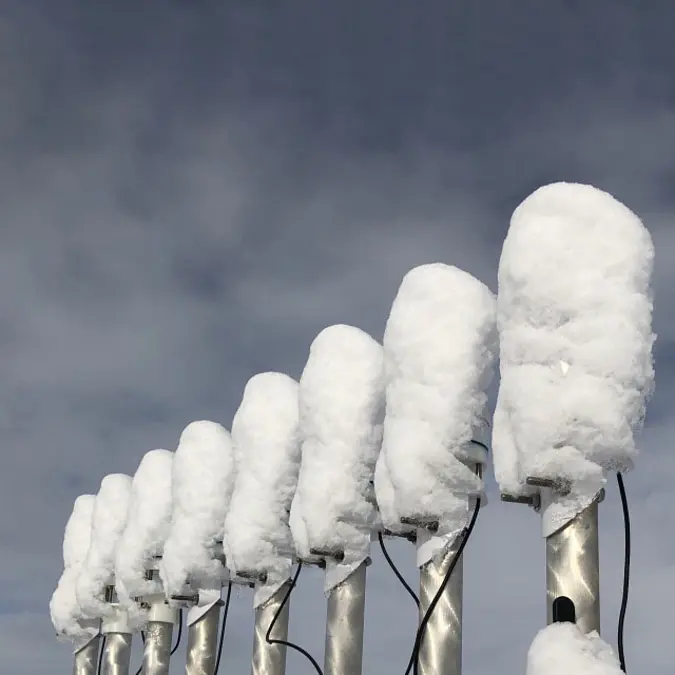
Solar radiation reaches the pyranometer as diffuse radiation and is suppressed until snow is removed or melts.
A couple of things may be observed when snow/ice are in the anemometer. One observation is that a blanket of snow shelters the opening of the anemometer, which dampens wind speed data.
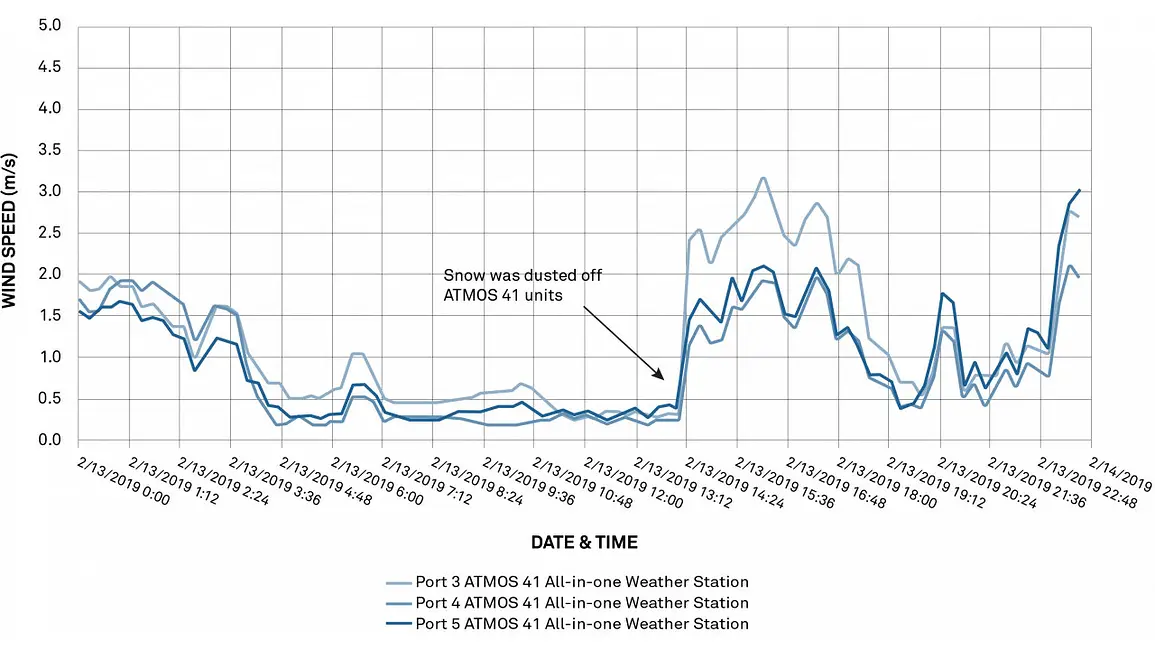
A second observation is that there could be wind speed spikes (we cap this at 30 m/s) or no sensor output (#N/A). In this case, a little data cleanup may be needed until the ice/snow buildup is removed or melts.
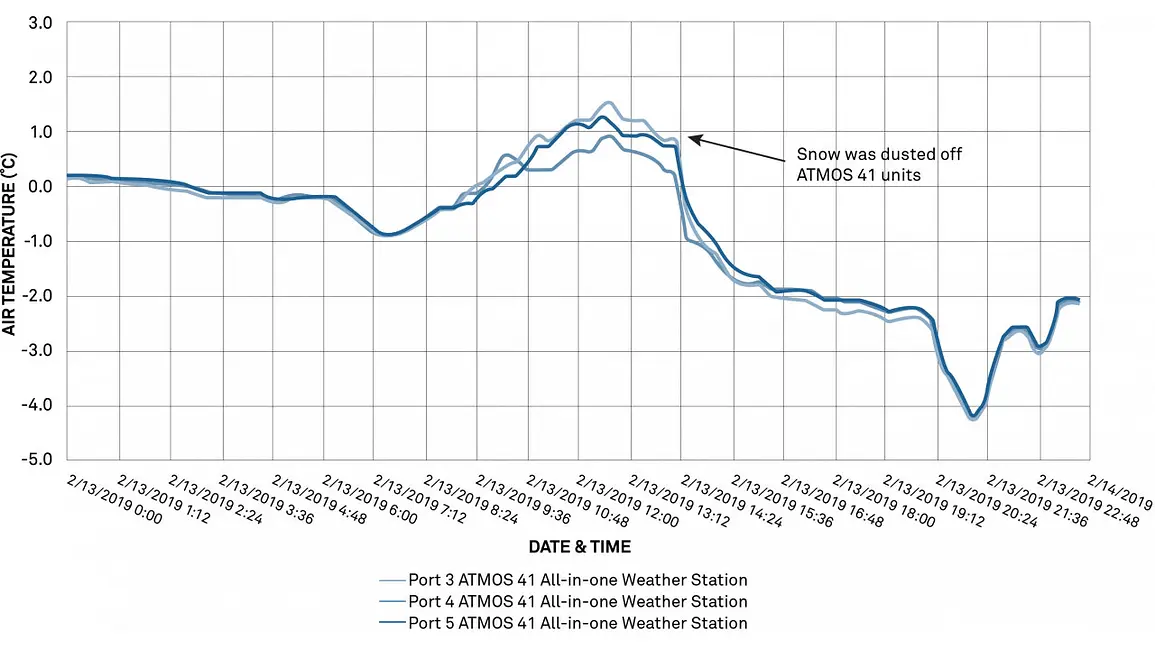
We observed that a blanket of snow covering the ATMOS 41 remote weather station insulates the unit, and a warmer air temperature will result until the snow is removed.
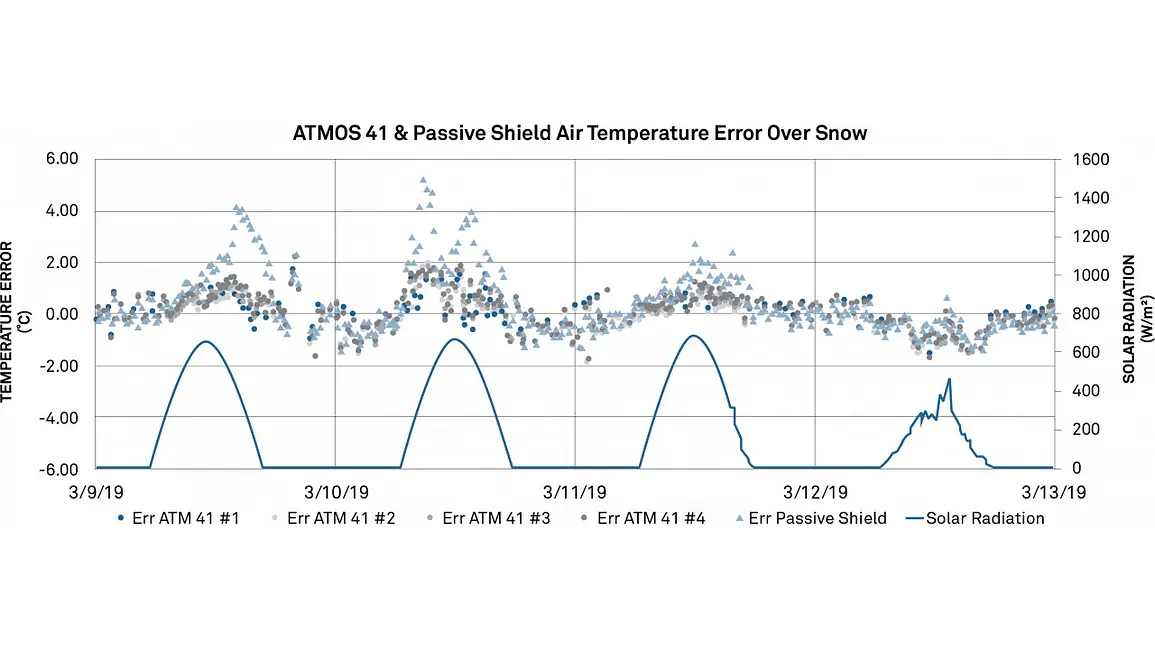
Overall, air temperatures track well when compared to a non-METER reference weather sensor (Apogee TS-110 fan-aspirated radiation shield with ST-100 thermistor), which was colocated on METER’s rooftop testbed and connected to a CR1000 data logger. Air temperature measurements over snow on clear-sky days range up to about 2 °C high under low wind speed conditions. This magnitude of error is expected due to the substantial increase in reflected shortwave radiation from snow with albedo near 1, and is much smaller than the error expected from air temperature measurements in a non-aspirated radiation shield (Figure 6).
With the ATMOS 41 remote weather station bird deterrent installed, expect to see dips in the pyranometer data at specific times of the day during clear sky conditions. This is caused by the wire shadows that move across the pyranometer weather sensor throughout the day on sunny days. There are negligible wire shadow effects on diffuse days, when there is continuous cloud cover. We estimated <6% error in total daily solar radiation for a clear sky day and <1% error for a diffuse day. Check out the data below, which were taken from METER’s rooftop testbed, March 2019.
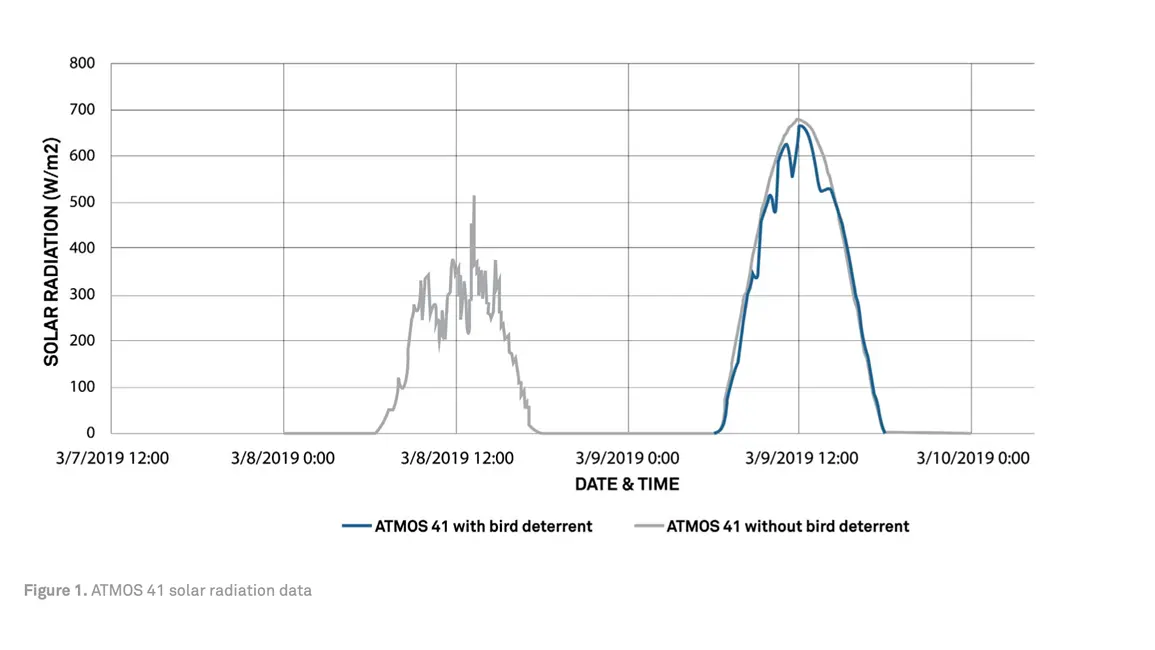
On a mostly clear-sky day, the error caused by the bird deterrent was a decrease in total solar radiation by 3.0% and 4.7% for two ATMOS 41 pyranometer sensors (3/7/2019). On a cloudy day, the error caused by the bird deterrent was less than 1% (3/8/2019). On a clear sky day, the error caused by the bird deterrent was a decrease in total solar radiation by 2.6% and 5.7% (3/9/2019). The error was estimated by summing the daily solar radiation of ATMOS 41 remote weather station units with bird deterrent (experimental) and without bird deterrent (control) and calculating the percent error. Data were collected at 5-minute intervals.
The data in Table 1 were collected from dates when there was no snow cover, and errors did not exceed 5% decrease in summed daily solar radiation.
| Sky condition, Date | Percent error of summed daily solar radiation Test 1 |
Percent error of summed daily solar radiation Test 2* |
|---|---|---|
| Partly cloudy, 3/14/2019 |
1.8% | 4.7% |
| Partly cloudy, 3/15/2019 |
2.4% | 2.1% |
| Partly cloudy, 3/16/2019 |
2.0% | 4.2% |
| Mostly sunny, 3/17/2019 |
2.4% | 3.7% |
| Sunny, 3/18/2019 |
2.1% | 4.2% |
| Sunny, 3/19/2019 |
2.3% | 4.1% |
| Sunny, 3/20/2019 |
2.3% | 4.1% |
| Mostly sunny, 3/21/2019 |
1.9% | 4.5% |
Table 1. Percent error of summed daily solar radiation by date
*Bird deterrent was not perfectly installed.
NOTE: Test 1 ATMOS was about 1% higher than the control when comparing baseline data with no bird spike; Test 2 ATMOS 41 was about -1% lower than the control when comparing baseline data with no bird spike (for summed daily radiation on a clear sky day).
Dips in solar radiation data are caused by the bird deterrent wire shadows on a clear sky day (see 3/9/2019 in Figure 1). The dips in solar radiation on sunny days will vary throughout the year as the sun angle changes. Solar radiation data are not affected by the bird deterrent on completely cloudy days, when no wire shadows are present (see 3/8/2019 in Figure 1).
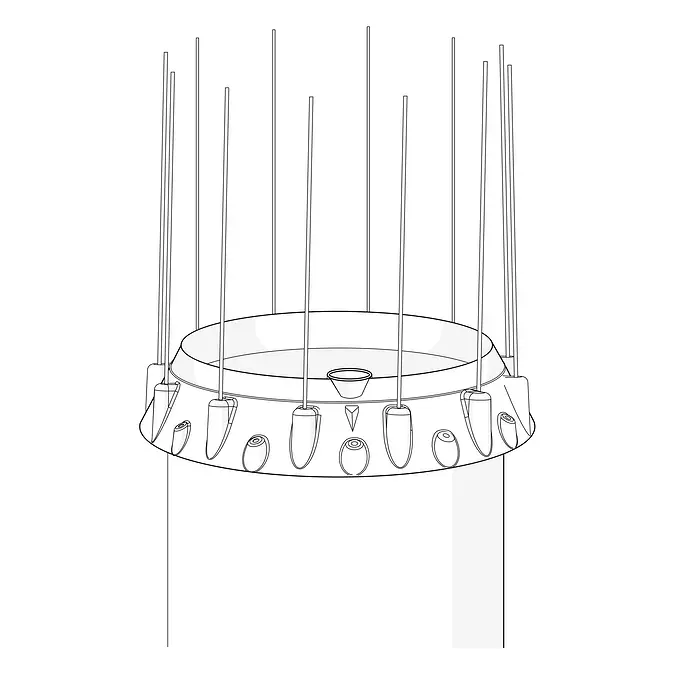
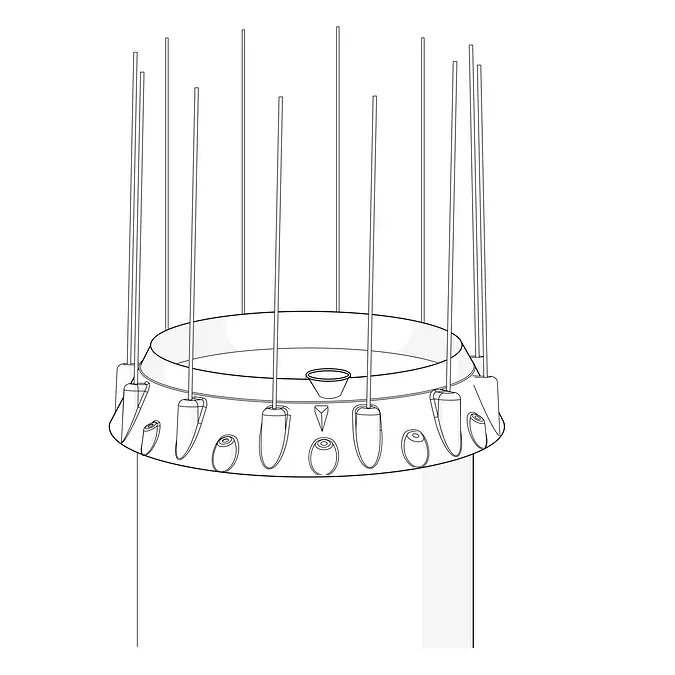
Correct bird deterrent installation (Figure 2) and incorrect installation (Figure 3) is shown below. The pyranometer sensor should be in the middle of two wires, indicated by the triangle. Expect increased error when bird deterrents are not correctly installed.
Without summing daily solar radiation, the percent error when the pyranometer dips are most drastic resulted in a decrease of 13-17% solar radiation (clear sky day). At METER’s testbed, this was a 83-113 W/m2 decrease when the wire shadows caused the most drastic dips on 3/9/2019 (Figure 4).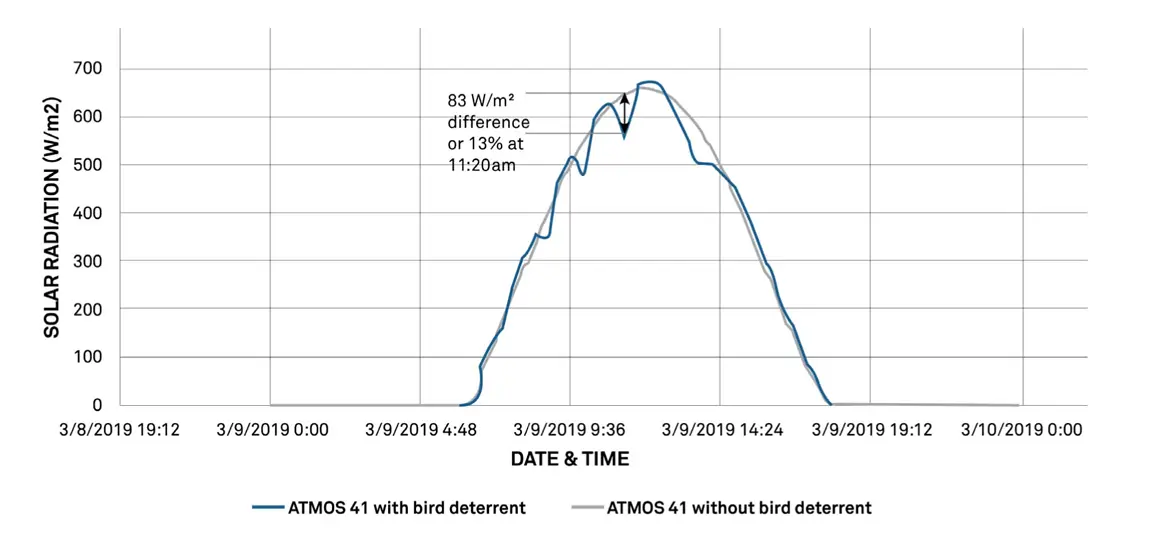
It is possible to use a clear-sky calculator to estimate solar radiation on sunny days; however, it would be challenging and not recommended to correct for bird deterrent shadow effects. The main reason is the shadows change over time, due to different cloud cover, time of day, time of year, and location.
Compare the data from a clear-sky day (when you know the pyranometer sensor was clean) to data on a day that should have produced clear-sky solar radiation measurements. If the comparison data indicate non-clear sky conditions on a day that should have been clear, this is an indication that the pyranometer sensor is dirty or obstructed. Collect and review a couple days of data to be sure it wasn’t a bird covering the sensor before making a field visit. When preparing for a field visit for a dirty pyranometer sensor, bring items to clean the sensor, funnel, downspout, and screen. Install a bird deterrent if bird droppings are present.
Our scientists have decades of experience helping researchers and growers measure the soil-plant-atmosphere continuum.
A comparison of common weather monitoring methods, pros and cons, and which technology might apply to different types of field research.
As a researcher, you need to optimize funding and maximize peer-reviewed paper output. ZENTRA Cloud’s powerful data management software makes it easier to succeed at both.
Researchers can use information about different plants' abilities to intercept and use PAR to engineer canopy structure modifications that significantly improve crop yield.
Receive the latest content on a regular basis.

