Publish more. Work less. Why ZENTRA system cuts research time in half
ZENTRA is a complete system of instruments, sensors, loggers, and software that are easily deployed, require little maintenance, and put near-real-time data at your fingertips.

As a researcher, you need to optimize funding and maximize peer-reviewed paper output. ZENTRA Cloud’s powerful data management software makes it easier to succeed at both. How? ZENTRA Cloud reduces your workload by speeding up analysis, streamlining your workflow, and simplifying data sharing. This means your team can spend less time setting up, maintaining, and downloading data—and more time publishing it.
Want to explore how ZENTRA Cloud works?
Request a ZENTRA Cloud live tour
Below is a comprehensive look at ZENTRA Cloud’s capabilities, information to get you started, and details on how it can revolutionize your research.
You and your collaborators can see your data the same hour it happens from anywhere in the world via your computer, tablet, or smartphone.
Data is graphed automatically as it is uploaded. Tool tips enable you to see the value of a parameter whenever you want to take a deeper look at your data.
View your data at different time scales and sensor resolutions.
ZENTRA Cloud and the ZL6 data logger work together to simplify your ability to visualize, manage, and share measurements from up to six sensor ports. Using METER multi-parameter sensors, you can visualize dozens of near-real-time measurements at once. Add more ZL6’s to your site, and you can track even more measurements.
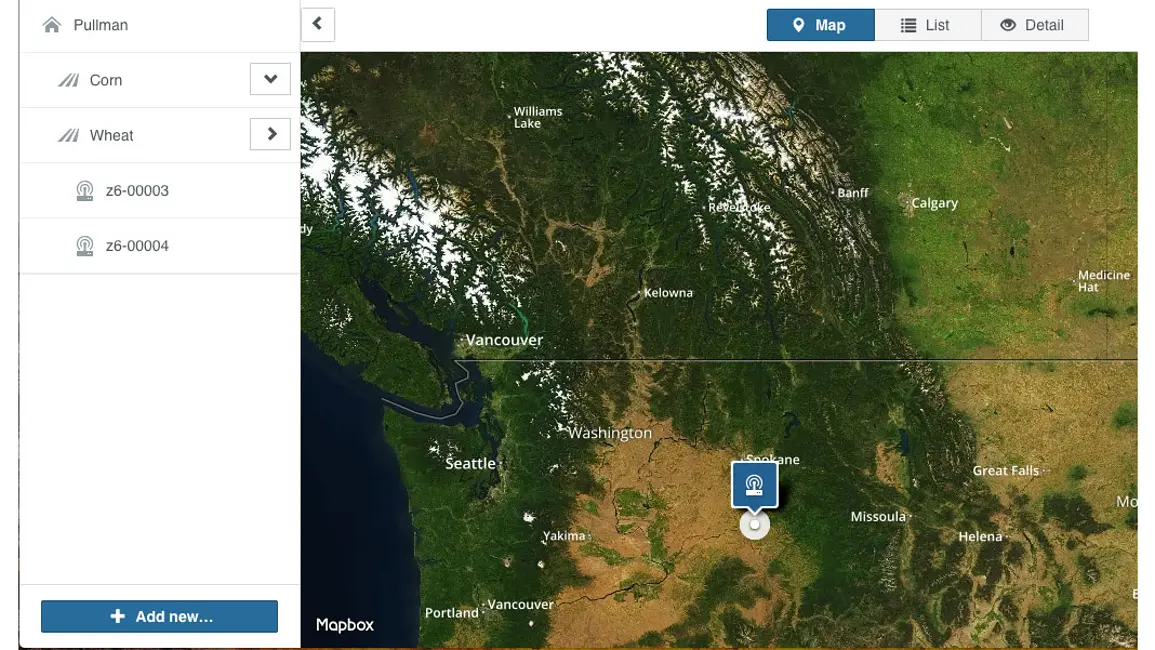
GPS signal tells you where your data loggers are installed and re-evaluates every 24 hours.
Fix setup errors and reconfigure sensors remotely.
ZENTRA Cloud tells you when your data logger batteries are low, which means no more surprise data gaps.
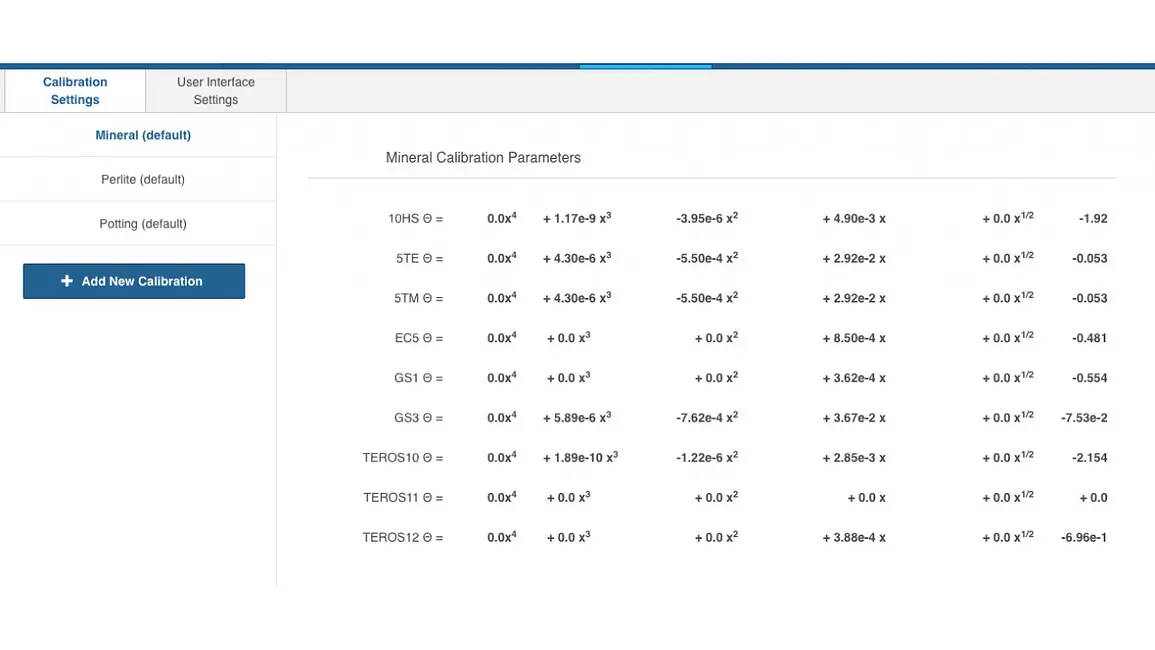
Adjust the data on your graphs using a custom calibration.
Change the settings on your data loggers from the comfort of your office.
Your logger automatically stays up to date with the latest operating system through the cloud.
To download your data to an excel spreadsheet, simply click the download button. Plus, ZENTRA Cloud’s convenient and intuitive API allows data analysis software to automatically harvest your data from its servers and run the analyses that lead to new discovery and publishable results.
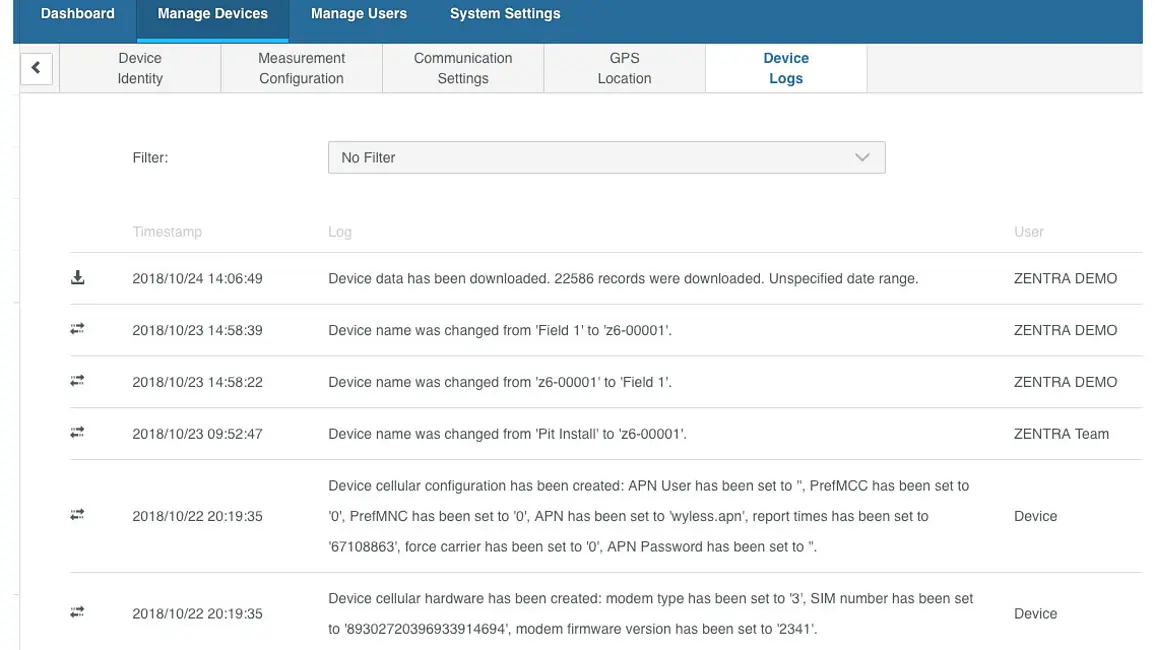
ZENTRA Cloud records how often the ZL6 is calling in, so you can check if things are working as expected.
You and your collaborators view trending data or analyze site conditions at the exact same time. Simply enter an email, and send an invitation. No password sharing needed.
You control the permissions of every collaborator or student. Bank-level encryption means your data is safe, and you’ll always have access to it, even if your subscription expires. Plus, data stored on the cloud means you never lose data when staffing changes. No more lost spreadsheets.
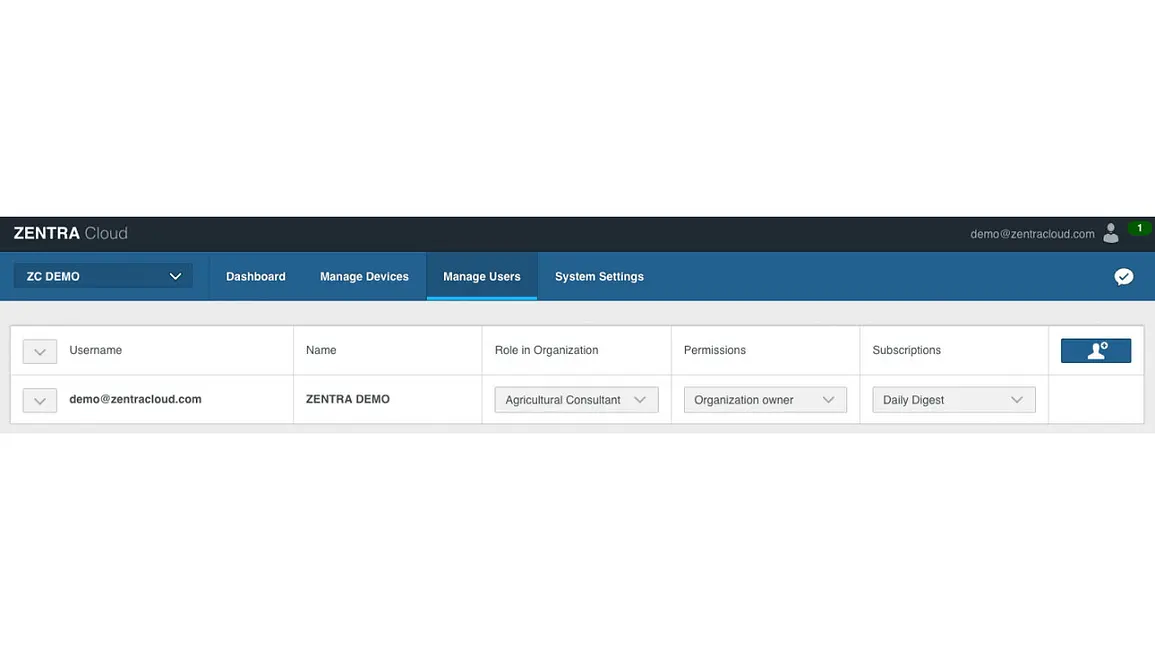
Every collaborator can review the data in the way they want. All units and ranges on the graphs are specific to each viewer.
1 – Set up an account
Create a ZENTRA cloud login.
2 – Add an organization
An organization is a stakeholder that owns or needs the data (i.e., a university or a farm).
3 – Add a site
A site is the name of the limited geographical area you are studying. It is possible to change a site to a farm depending on user settings.
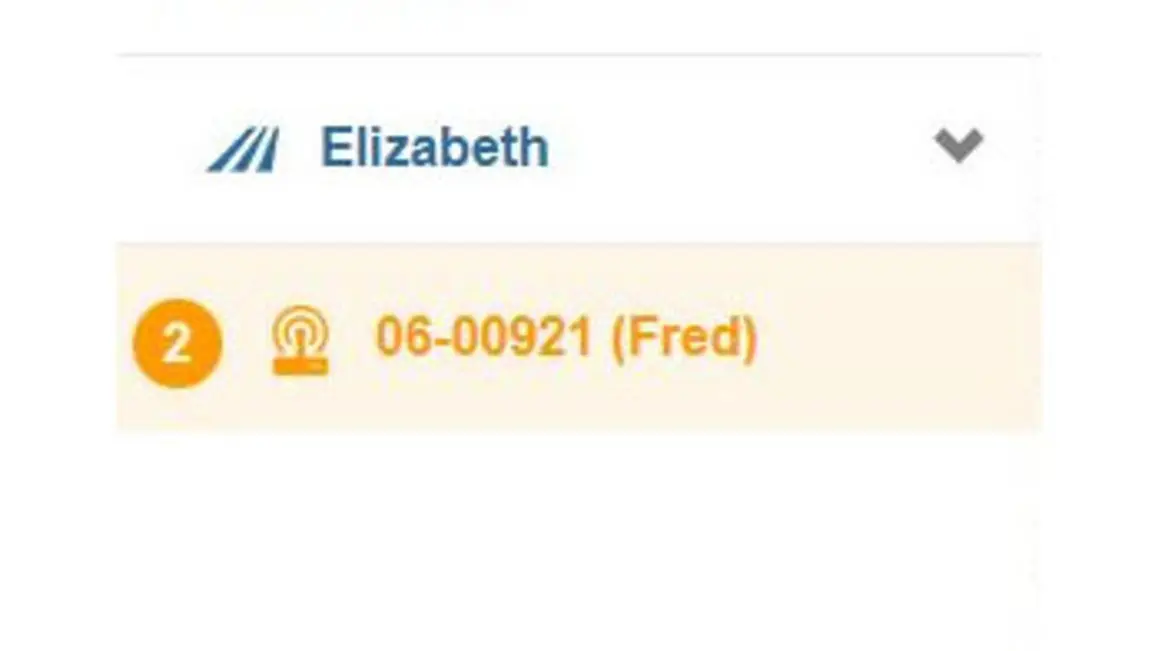
4 – Add a plot
A plot is a geographical area within a site that is typically measured by one data logger. It is possible to change a plot to a field depending on user settings.
5 – Connect a device
In the video below, METER research scientist Dr. Colin Campbell discusses how ZENTRA Cloud simplifies the research process and why researchers can’t afford to live without it.
Want to explore how ZENTRA Cloud works?
Request a ZENTRA Cloud live tour
Learn about ZENTRA Cloud environmental models here
| Category | Features | Benefits |
|---|---|---|
| Near Real-Time Data Visualization | See data the hour it happens | Access and visualize current data from wherever you are |
| Automated graphing | No combing through imported spreadsheets to find what you need. Pull up already-graphed, near real-time data to teach students or inform collaborators | |
| Visualization of up to dozens of measurements per data logger | Make informed decisions from the comfort of your office (i.e., when it’s time to sample or irrigate) | |
| Customized graph viewing | View data at different time scales and sensor resolutions | |
| GPS mapping | Send a new collaborator directly to data logger location | |
| Data aggregated and stored on the cloud | Never lose data when staffing changes. No more lost spreadsheets. | |
| Tool tips | See the value of a parameter at any point in time on a graph. Compare today’s site behaviors to other time periods. | |
| Bank-level encryption | Your data is safe, and you’ll always have access to it, even if your subscription expires | |
| Mobile friendly | ZENTRA Cloud is available for viewing via computer, tablet, or smartphone | |
| Remote Device Management | Remote configuration | Manage devices from anywhere in the world. Reduce technician time and unnecessary field visits. |
| Automatic low battery alert | Eliminate data gaps | |
| Customized calibrations | Adjust the data on your graphs using a custom calibration | |
| Remote data logger management | Change how often your data logger connects to the cellular network or records data from the comfort of your office | |
| Download data to Excel | Downloads are as easy as one click | |
| Firmware over the air | Your data logger updates automatically. No more wondering if your logger has the latest operating system. | |
| Device logs | Records how often the ZL6 is calling in | |
| Intuitive API | Easy data processing…ZENTRA Cloud’s convenient and intuitive API allows data analysis software to automatically harvest your data from its servers and run the analyses that lead to new discovery and publishable results | |
| Instant Data Sharing | Near-real-time data sharing | Collaborators, students, and presentation audiences can see important trending information or current site conditions as they happen |
| Click. Share. Done. | Enter an email and collaborators gain instant access. Invite an unlimited amount of users at no extra charge. | |
| Permissions control | You control the permissions of every collaborator or student | |
| Customized viewing | Every collaborator can view the data the way they want to see it |
Our scientists have decades of experience helping researchers and growers measure the soil-plant-atmosphere continuum.
ZENTRA is a complete system of instruments, sensors, loggers, and software that are easily deployed, require little maintenance, and put near-real-time data at your fingertips.
TDR, FDR, capacitance, resistance: A comparison of common soil moisture sensing methods, their pros and cons, and their unique applications.
We performed comparison testing for ATMOS 41 vs. high-quality, research-grade non-METER sensors and conducted time-series testing for sensor-to-sensor variability. Here are the results.
Receive the latest content on a regular basis.

