Video: How to calibrate METER soil moisture sensors
Step-by-step instruction guide for performing METER soil moisture sensor calibrations

If you want accurate data, correct sensor installation should be your number one priority. When measuring in soil, natural variations in density may result in accuracy loss of 2 to 3%, but poor installation can potentially cause accuracy loss of greater than 10%. Proper sensor installation is the foundation for the data you collect. If you have a poor foundation, it makes data interpretation difficult. In this article, get insider tips on how to install soil moisture sensors faster, better, and for higher accuracy. Learn:
To understand why poor sensor installation has an enormous impact on the quality of your data, you’ll need to understand how soil moisture sensors work.
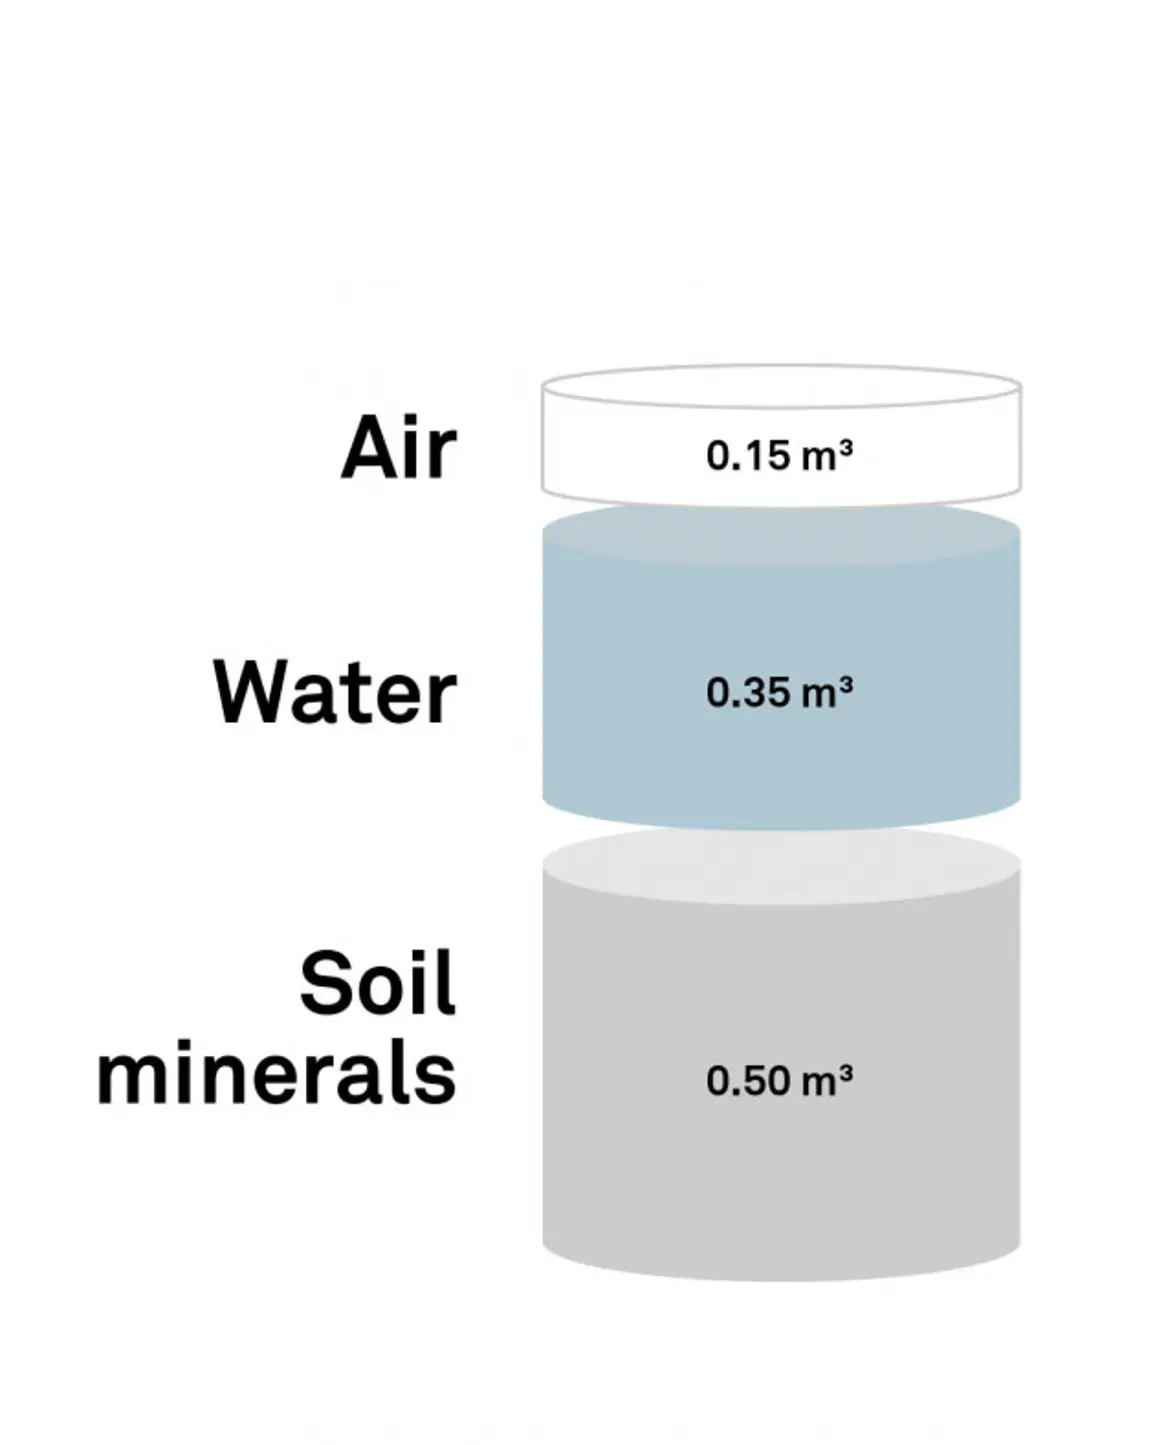
Soil moisture sensors (water content sensors) measure volumetric water content. Volumetric water content (VWC) is the volume of water divided by the volume of soil (Equation 1) which gives the percentage of water in a soil sample.

So, for instance, if a volume of soil (Figure 1) was made up of the following constituents: 50% soil minerals, 35% water, and 15% air, that soil would have a 35% volumetric water content.
All METER soil moisture sensors use an indirect method called capacitance technology to measure VWC. “Indirect” means a parameter related to VWC is measured, and a calibration is used to convert that amount to VWC. In simple terms, capacitance technology uses two metal electrodes (probes or needles) to measure the charge-storing capacity (or apparent dielectric permittivity) of whatever is between them.
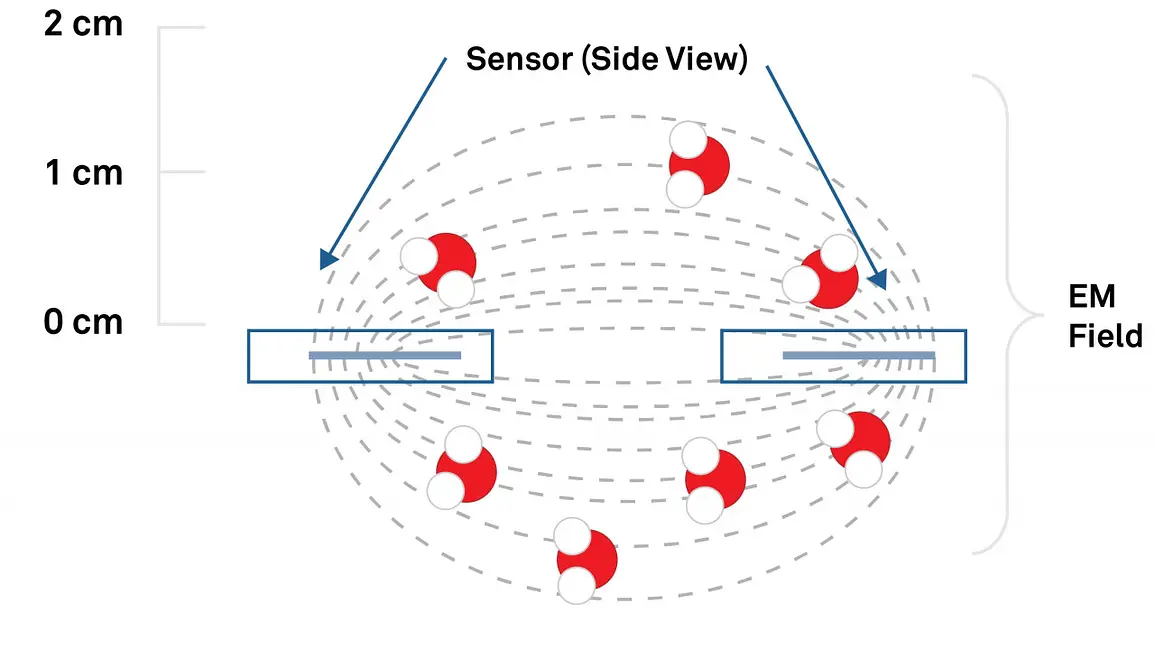
Table 1 illustrates that every common soil constituent has a different charge-storing capacity. In soil, the volume of most of these constituents stay constant over time, but the volume of air and water fluctuates.
| Material | Apparent Dielectric Permittivity |
|---|---|
| Air | 1 |
| Soil Minerals | 3-16 |
| Organic Matter | 2-5 |
| Ice | 5 |
| Water | 80 |
Table 1. Charge-storing capacity (apparent dielectric permittivity) of common soil constituents
Since air stores almost no charge and water stores a large charge, it’s possible to measure the change in the charge-storing ability of a soil and relate it to the amount of water (or VWC) in that soil. (For a more detailed explanation of capacitance technology watch Soil Moisture 201).
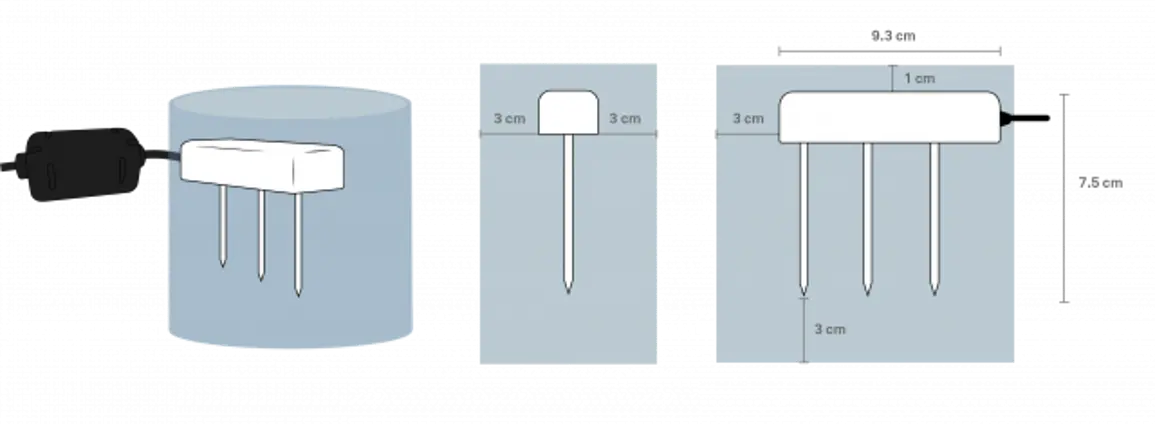
Volume of influence (Figure 3) is the area of soil measured by the electromagnetic field emitted by the sensor needles. Figure 2 (above) shows an approximation of the relative strength of the electromagnetic field. Note that most of the sensitivity of the sensor is within a few millimeters of the probe needles. Anything within this electromagnetic field will affect the output of the sensor, however, the percentage of water right next to the needles has a larger influence on the response of the sensor than the area further away from the needles.
Because the volume of influence in dielectric soil moisture sensors (TDR, FDR, capacitance types) is the most sensitive near the needle, avoiding air gaps with good soil-to-sensor contact is essential to getting quality soil moisture data. Also, it’s important to generate the least amount of soil disturbance possible during an installation to obtain a representative measurement. Installing sensors into disturbed soil (a pile of soil taken out of a hole, for example) is rarely a good idea but is a common mistake inexperienced researchers make.
Read “5 ways site disturbance impacts data”
Scenario 1: Air gaps in wet soils
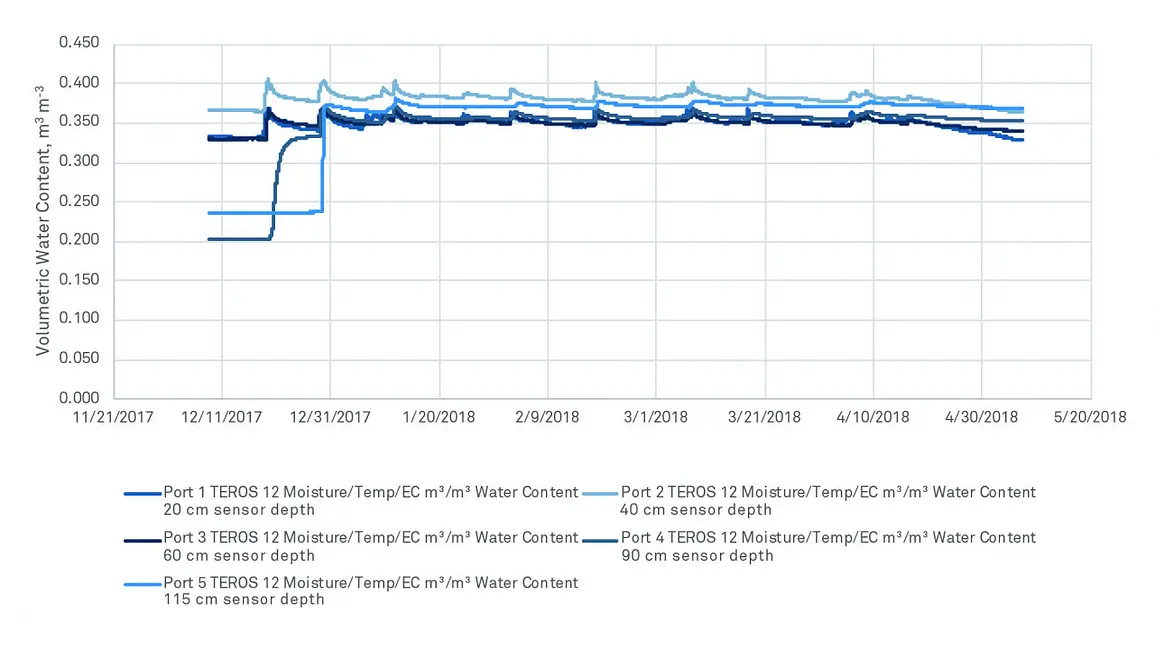
Figure 4 is an example of a good installation. It’s a dataset from a rice field showing three different soil moisture sensors installed about 7.5 cm into the soil.
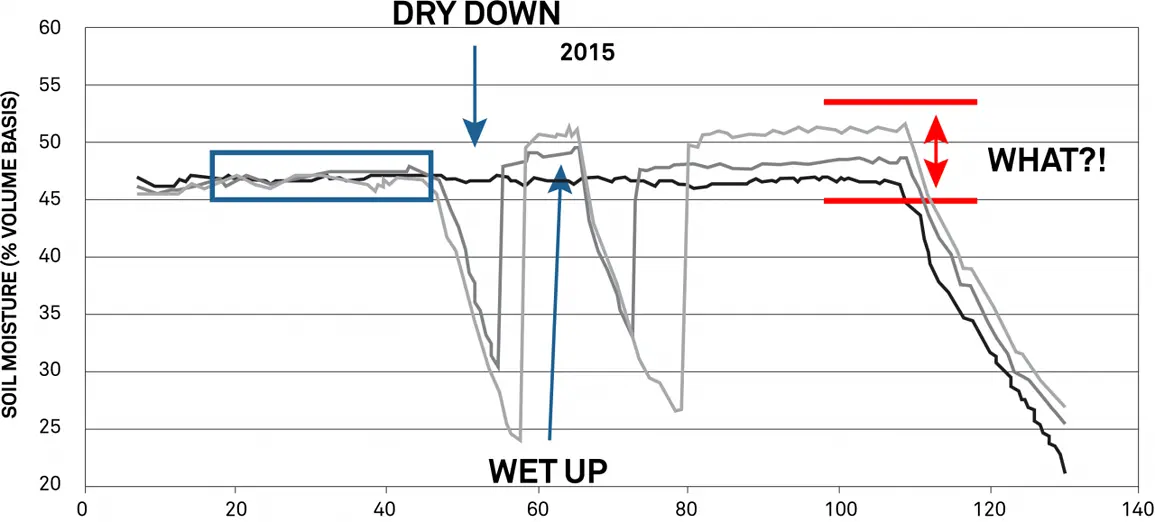
On the y-axis is volumetric water content in percent, and on the x-axis is number of days. The solid black trace is where the rice field was continually flooded. The solid gray trace shows where the researcher was drying the soil down to 35% VWC. And the dotted trace illustrates drying down to 25% VWC. Note that at first, sensor-to-sensor variability is within approximately 1%. This is what you want to see for the same water conditions in the same soil type.
However, this researcher noticed that during later floodings, the saturation level of the treatments was much higher than where they started. Why? These sensors were installed in clay vertisols with a high shrinking and swelling capacity. In this soil type, large cracks can open up as the soil dries down. When soils open up and provide a gap for more water to be right next to the needles, the reading will be higher because water has a dielectric of 80, much higher than soil. This is also a good example of what happens when a poor sensor installation leaves air gaps in the soil on the saturated end.
Scenario 2: Air gaps in dry soils
Figure 5 shows a time series for a near-surface installation into a highly porous, coarse substrate soil in Nevada that gets very dry.
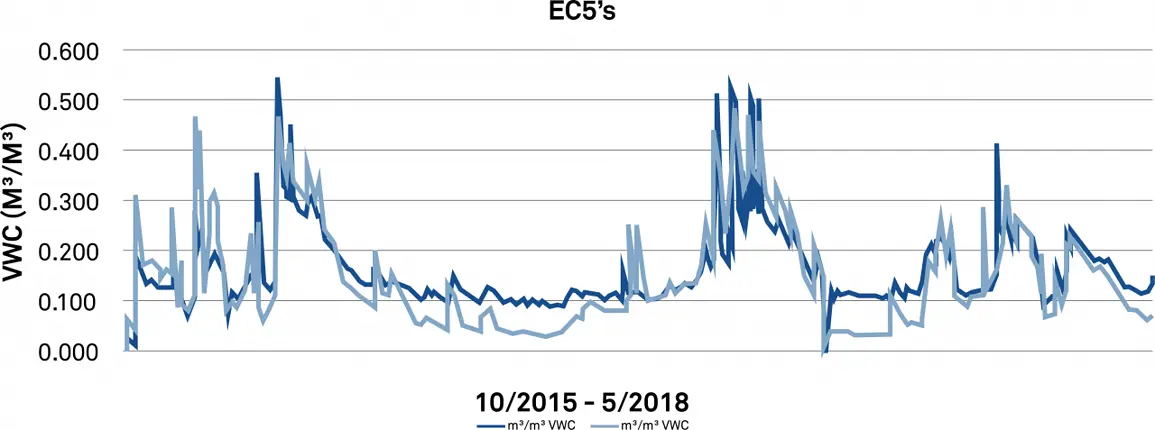
The dark blue trace shows sensors installed underneath the plant, and the light blue traces are sensors installed further from the plants. Figure 5 is what a good dataset with no installation problems looks like in a dry soil.
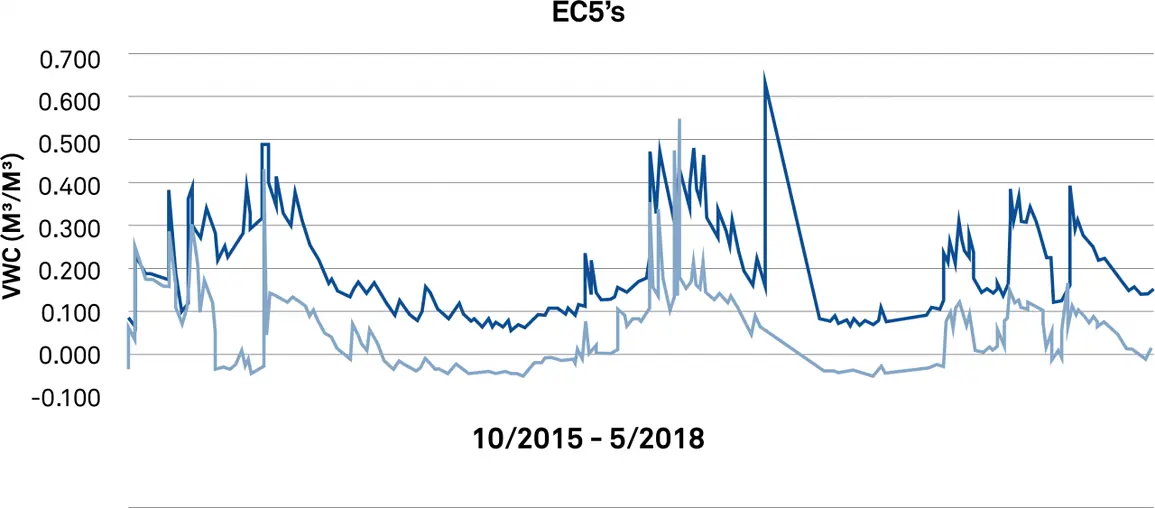
Figure 6, a time series from a nearby site with the same experimental design, illustrates a different story. Note the large gap between what’s happening beneath the plant vs. what’s happening away from the plant. This is a red flag that something is wrong. In some spots, the VWC is dipping below 0%, which by definition is the lowest that soils can possibly get. But remember, air has a dielectric less than that of soil. So this probably means the sensors are experiencing some air influence. It could be a calibration issue, but it’s less likely because the same sensors installed nearby are performing slightly differently. So this data is either indicative of an air gap near the sensor needles, of a sensor too close to the surface that is emitting its electromagnetic field into the air, or that a sensor has been disturbed.
Getting high-quality data starts before the actual installation. Below are some common mistakes people make when designing a study that cost them time and money and may prevent their data from being usable.
Consider these issues when designing a study, and use the following best practices to avoid future problems.
Before going to the field, set up a few sensors in the lab and take readings in different soil types. This provides a solid understanding of what soil moisture values to expect in different scenarios. And it helps you to understand correct installation, how long an installation might take, what tools you’ll need, and any problems, such as a sensor that might be reading incorrectly. Prepare a dedicated installation toolbox filled with important tools such as zip ties, pliers, markers, flashlights, and batteries. This saves hours of trips back and forth to the site.
If using a data logger that needs programming, learn the programming language two weeks in advance to ensure you understand how to write programs for the logger. Even a plug-and-play, cloud data logger such as the ZL6 needs prep work, such as making sure the research site is in range of a cell tower.
The more metadata you record at your research site, the better you will understand your data. Label each sensor with sensor type, installation depth, and any other important information. If installing hundreds of sensors, you can purchase an electronic labeling device to barcode the sensors, but tape and a permanent marker also work. Tuck the labels inside the data logger for protection from the weather.
The ZL6 data logger automatically records important metadata, such as GPS location, barometric pressure, and sensor serial number and saves it to the cloud. ZENTRA Cloud also lets you record user input metadata such as soil type, soil density, types of cover, measurement interval, raw data and type of calibration used, sensor depth, notes on why the site was picked, etc. This information will be important when it’s time to publish, and putting it in a shared, cloud-based location like ZENTRA Cloud will save headaches.
Download a free site characterization worksheet
In addition, ancillary measurements such as soil temperature or microclimate monitoring can be another source of metadata. An all-in-one weather station such as the ATMOS 41 automatically records weather events and can be an important way to benchmark or ground truth soil moisture, water potential, or other data.
Figure 7 is an illustration of sensors installed correctly (looking down a borehole) in a soil profile with good soil-to-sensor contact.

Soil-to-sensor contact is the most important thing to remember to obtain good soil moisture data because, as mentioned, the first few millimeters next to the probe have the most influence on the reading.
A borehole installation performed using a small hand auger and METER’s TEROS Borehole Installation Tool creates a hole only 10 cm in diameter—just 2-3% of the area of a trench. Because the scale of the site disturbance is minimized, fewer macropores, roots, and plants are disturbed, and the site can return to its natural state much faster. And when the installation tool is used inside a small borehole, good soil-to-sensor contact is ensured, even in hard soils. A small borehole makes it much easier to separate the horizon layers and repack to the correct soil density because there is less soil to separate.
Figure 7 also shows sensor cables that are bundled, buried, and sheathed in conduit. Protecting sensors at all costs is critical to a study. It’s important to sheath exposed sensor cables inside PVC pipe, wire loom, or flexible electrical conduit and run it up the data logger post for approximately 60 cm (2 ft.). This will prevent damage by rodents, tractors, or shovels. Tie cables neatly to the post with UV-resistant zip ties, so they are tightly held but not pulling against the data logger (make sure there is some strain relief).
After sensor installation but before closing the auger hole or trench, check the sensors with a ZSC, a tiny tool that enables instantaneous readings on your smartphone to make sure the sensor reading is accurate. It will be painful to dig up a sensor later after collecting a season’s worth of bad data.
Over time, check data as often as possible to troubleshoot issues and prevent problems that can be detrimental to your research project. ZENTRA Cloud and the ZL6 enable you to troubleshoot and graph data as often as every day. Only two to three minutes spent spotting trends or discovering errors may save weeks of lost data. You can even set up ZENTRA Cloud alerts to send you notifications when things aren’t right.
Figure 10 is an illustration of what NOT to do in a sensor installation.
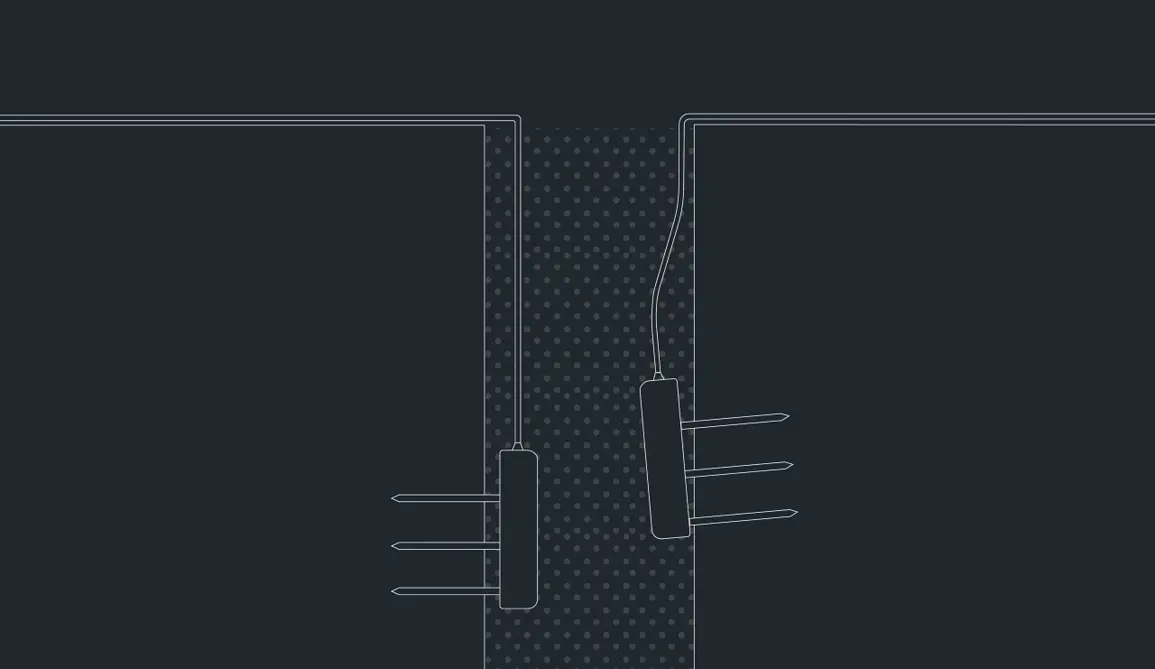
These are sensors installed in a 10-cm (4-in) borehole in a rocky soil where the sensors were pushed in by hand. In this case, the researcher had difficulty pushing the bottom right sensor in, so there is an air gap of 2 cm (almost an inch). This will definitely impact the quality of the data. He tried moving the sensor around to different places and hit a rock every time. In the end, he packed soil around the sensor which is not an ideal situation, but in this case, it was the best he could do.
The following video shows installation best practices for TEROS soil moisture sensors.
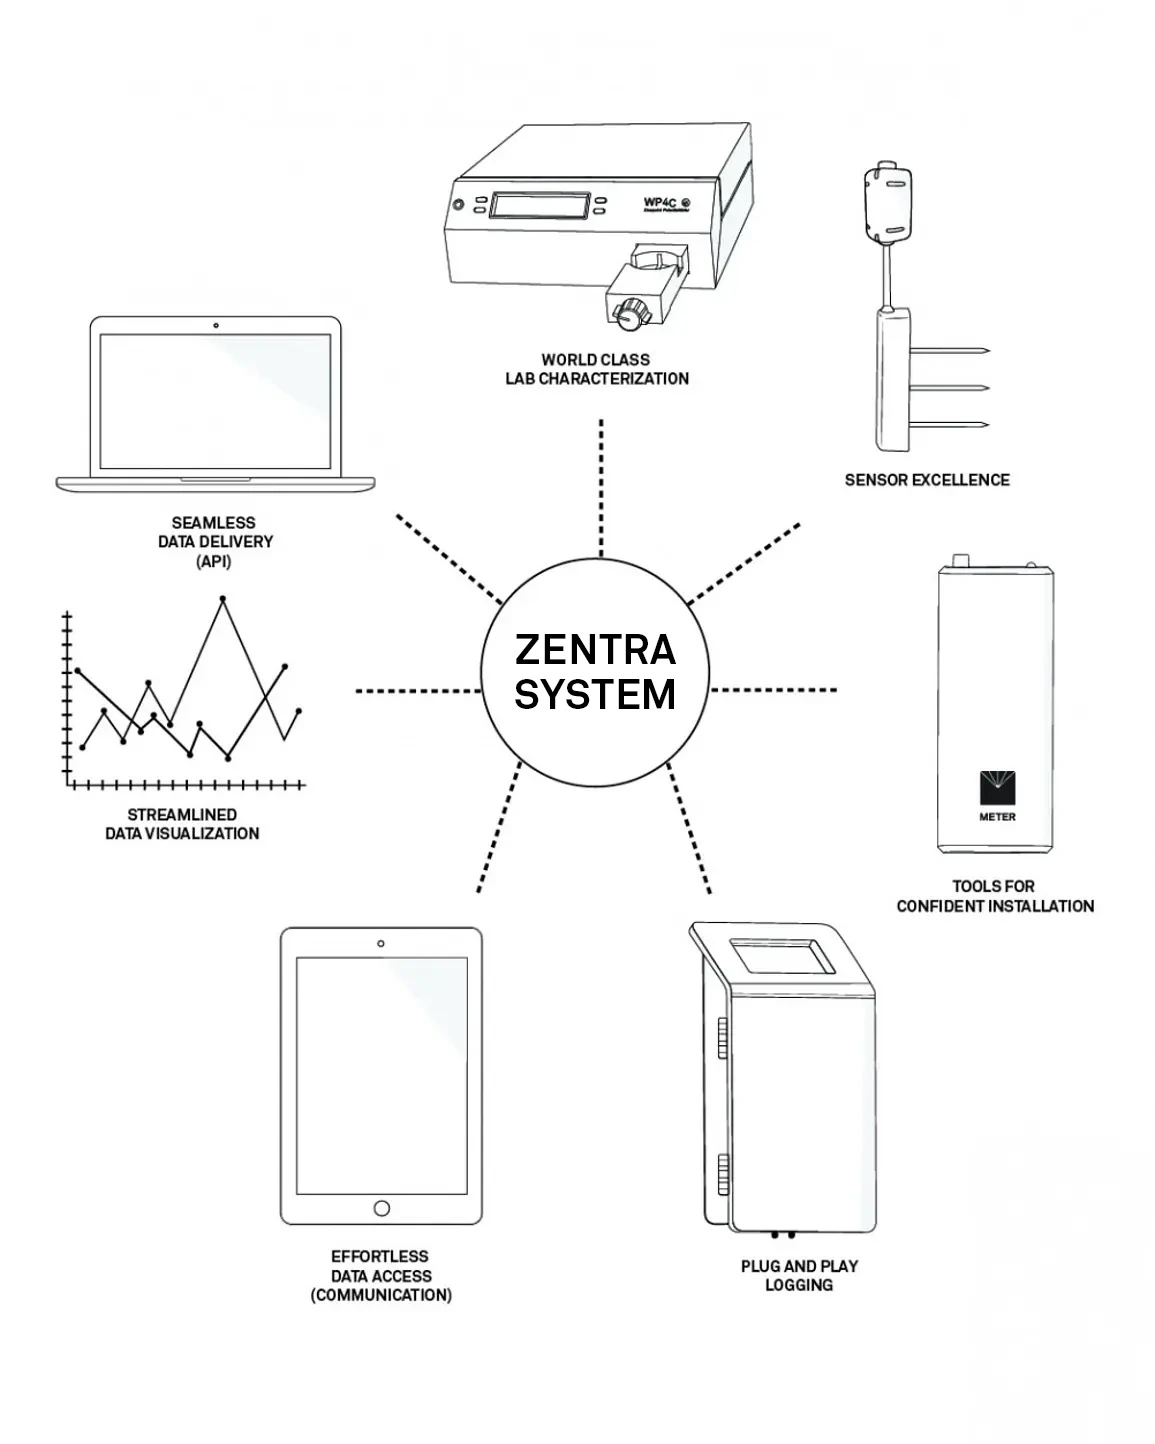
We created the ZENTRA system to reduce the time and effort it takes to get good quality soil moisture data. ZENTRA is a complete system of sensors, loggers, and software that are easily deployed, require little maintenance, and put near-real-time data at your fingertips so you can publish more, and work less. Here’s how:
Good soil-to-sensor contact with no air gaps, requires that the sensors be pushed straight into the sidewall with no wiggling. METER makes this much easier with the borehole installation tool. The tool uses mechanical advantage to drive TEROS soil moisture sensors straight into the sidewall of even difficult soils for maximum soil-to-sensor contact in much less time.
During sensor installations, the new ZSC Bluetooth sensor interface lets you monitor a sensor reading as it is installed.
It provides real-time, wireless readings via Bluetooth on your smartphone. Readout values are displayed in ZENTRA Utility Mobile to help you detect installation problems (poor sensor-to-soil contact, air pockets, rocks, etc.) before you repack the hole or trench.
The ZSC also solves SDI-12 headaches. You can use the ZSC to find out exactly where problem sensors are. Plus, the ZSC allows the user to assign SDI-12 addresses to digital sensors for easier SDI-12 programming.
ZENTRA Cloud works with the ZL6 data logger to let you manage your data loggers, fix setup errors, and reconfigure sensors remotely, from the comfort of your office, eliminating unnecessary field visits and wasted time.
You can even use ZENTRA Cloud to make sure your technician completed all the necessary field tasks correctly. If a grad student leaves your program, you no longer need to worry that the data will go with them. ZENTRA Cloud provides a simple place for all the data to be stored over the length of your research.
The ZL6 automatically records important metadata, such as sensor type, serial number, firmware version, and logger location and saves it to the cloud. That metadata, along with user-input metadata such as sensor depth and sensor height, become permanent parts of your data record, which will never be lost. In addition, real-time cloud data makes data sharing with many different stakeholders a breeze.
We created the new TEROS sensor line as part of the ZENTRA system to eliminate barriers to good accuracy such as installation inconsistency, sensor-to-sensor variability, and sensor verification.
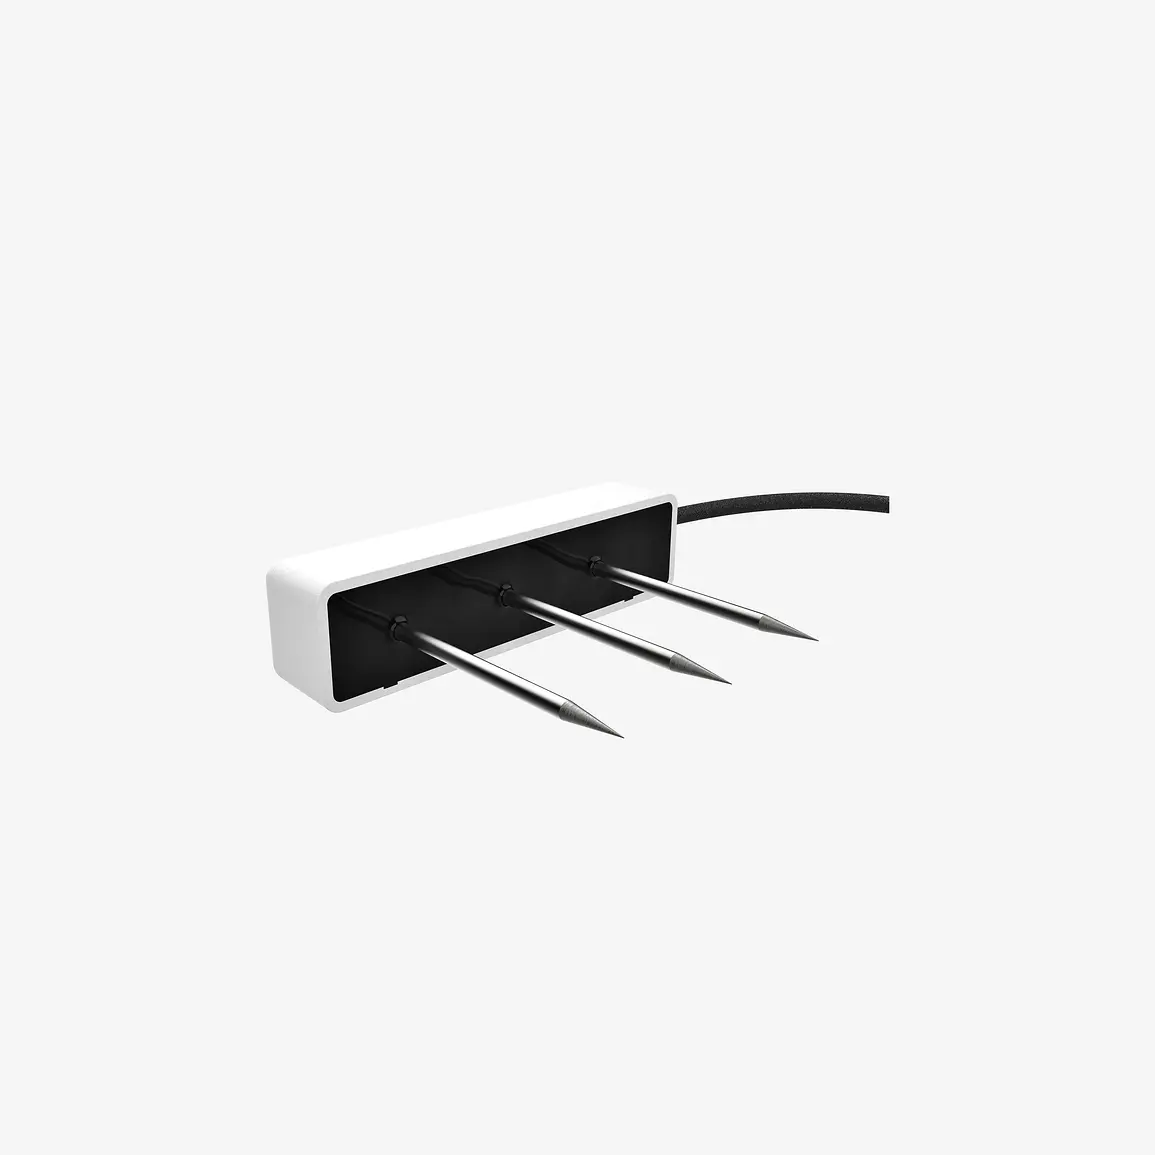
TEROS soil moisture sensors work together with the entire ZENTRA system to go beyond their predecessors and optimize the accuracy of not just the sensor, but the whole data set. They combine consistent, flawless installation with an installation tool, extremely robust construction, minimal sensor-to-sensor variability, a large volume of influence, a verification standard, and advanced data logging to deliver the best performance, accuracy, ease-of-use, and reliability at a price you can afford.
| TEROS 12 | TEROS 11 | TEROS 10 | |
|---|---|---|---|
| Measures | Volumetric water content, temperature, electrical conductivity | Volumetric water content, temperature | Volumetric water content |
| Volume of Influence | 1010 mL | 1010 mL | 430 mL |
| Research Grade Accuracy | ±3% VWC typical in mineral soils that have solution EC <8 dS/m | ±3% VWC typical in mineral soils that have solution EC <8 dS/m | ±3% VWC typical in mineral soils that have solution EC <8 dS/m |
| Field Lifespan | 10+ years | 10+ years | 10+ years |
| Measurement Output | Digital SDI-12 | Digital SDI-12 | Analog |
| Durability | Highest | Highest | Highest |
| Installation | Installation tool for high accuracy | Installation tool for high accuracy | Installation tool for high accuracy |
| Repeatability | Accuracy verification standard | Accuracy verification standard | Accuracy verification standard |
| Cost | Low | Low | Lowest |
| Guarantee | 3 years | 3 years | 3 years |
Table 1. TEROS sensor comparison
Watch the video below to see soil moisture expert Leo Rivera explain in detail why we spent 20 years creating the new TEROS water content sensor line.
The TEROS sensor line leverages advances in calibration techniques, an installation tool, and better raw materials to produce sensors that are more durable, accurate, easier and faster to install, more consistent, and linked to a powerful, intuitive near-real-time data logging and visualization system called ZENTRA Cloud.
See all TEROS sensors
Take a deep dive into learning about soil moisture. In the webinar below, Dr. Colin Campbell discusses how to interpret surprising and problematic soil moisture data. He also teaches what to expect in different soil, site, and environmental situations.
Everything you need to know about measuring soil moisture—all in one place.
Six short videos teach you everything you need to know about soil water content and soil water potential—and why you should measure them together. Plus, master the basics of soil hydraulic conductivity.
Our scientists have decades of experience helping researchers and growers measure the soil-plant-atmosphere continuum.
Step-by-step instruction guide for performing METER soil moisture sensor calibrations
Learn best practices for a borehole soil moisture sensor installation using the TEROS Borehole Installation Tool and TEROS Soil Moisture Sensors.
Even one small oversight, such as poor installation, can compromise accuracy by up to +/-10%. How can you ensure your data represent what’s really happening at your site?