Explore articles, podcasts, case studies, and best practices written by scientists who’ve spent decades in the field. From soil physics to sensor setup, this is your source for actionable, research-grade guidance.
Get clear, direct answers from a team that understands your methods and your mission. Whether you need instructional videos, troubleshooting tips, or technical insight, we’re here to make complexity simple.
From sensor calibration to lab-based measurement services, our team helps you collect meaningful data with precision and efficiency—so you can focus on the science, not the setup.
Not all soil moisture sensor methods are created equal
TDR, FDR, capacitance, resistance: An internet search today turns up thousands of options for measuring soil moisture, from sensors indicating moisture with a dial to sensors monitored electronically using a simple microprocessor. The sheer number of sensors on the market is confusing and frustrating when you simply want to find out which sensor provides the most reliable, robust, accurate, and publishable data.
For over two decades, METER scientists have spent thousands of hours installing soil moisture sensors and monitoring, interpreting, and publishing data from field experiments. Over time, we’ve learned a great deal about how to obtain quality soil moisture data. In this article, we share that expertise with you. Below is a comparison of common soil sensing methods, each method’s scientific measurement theory, pros and cons, and which technology might apply to different types of field research. Also learn why modern soil moisture sensing is about more than just the sensor.
What are you trying to measure?
One difficulty with searching for a soil sensor on the internet is the term “soil moisture sensor” is not specific enough. Moisture in soil could refer to two different things: water content (the amount or percentage of water in soil) or water potential, also known as soil suction (the energy state of water in soil). One is an extensive variable, and the other is an intensive variable (learn about these variables here). A search using the term “soil moisture sensor” will turn up both types of sensors.
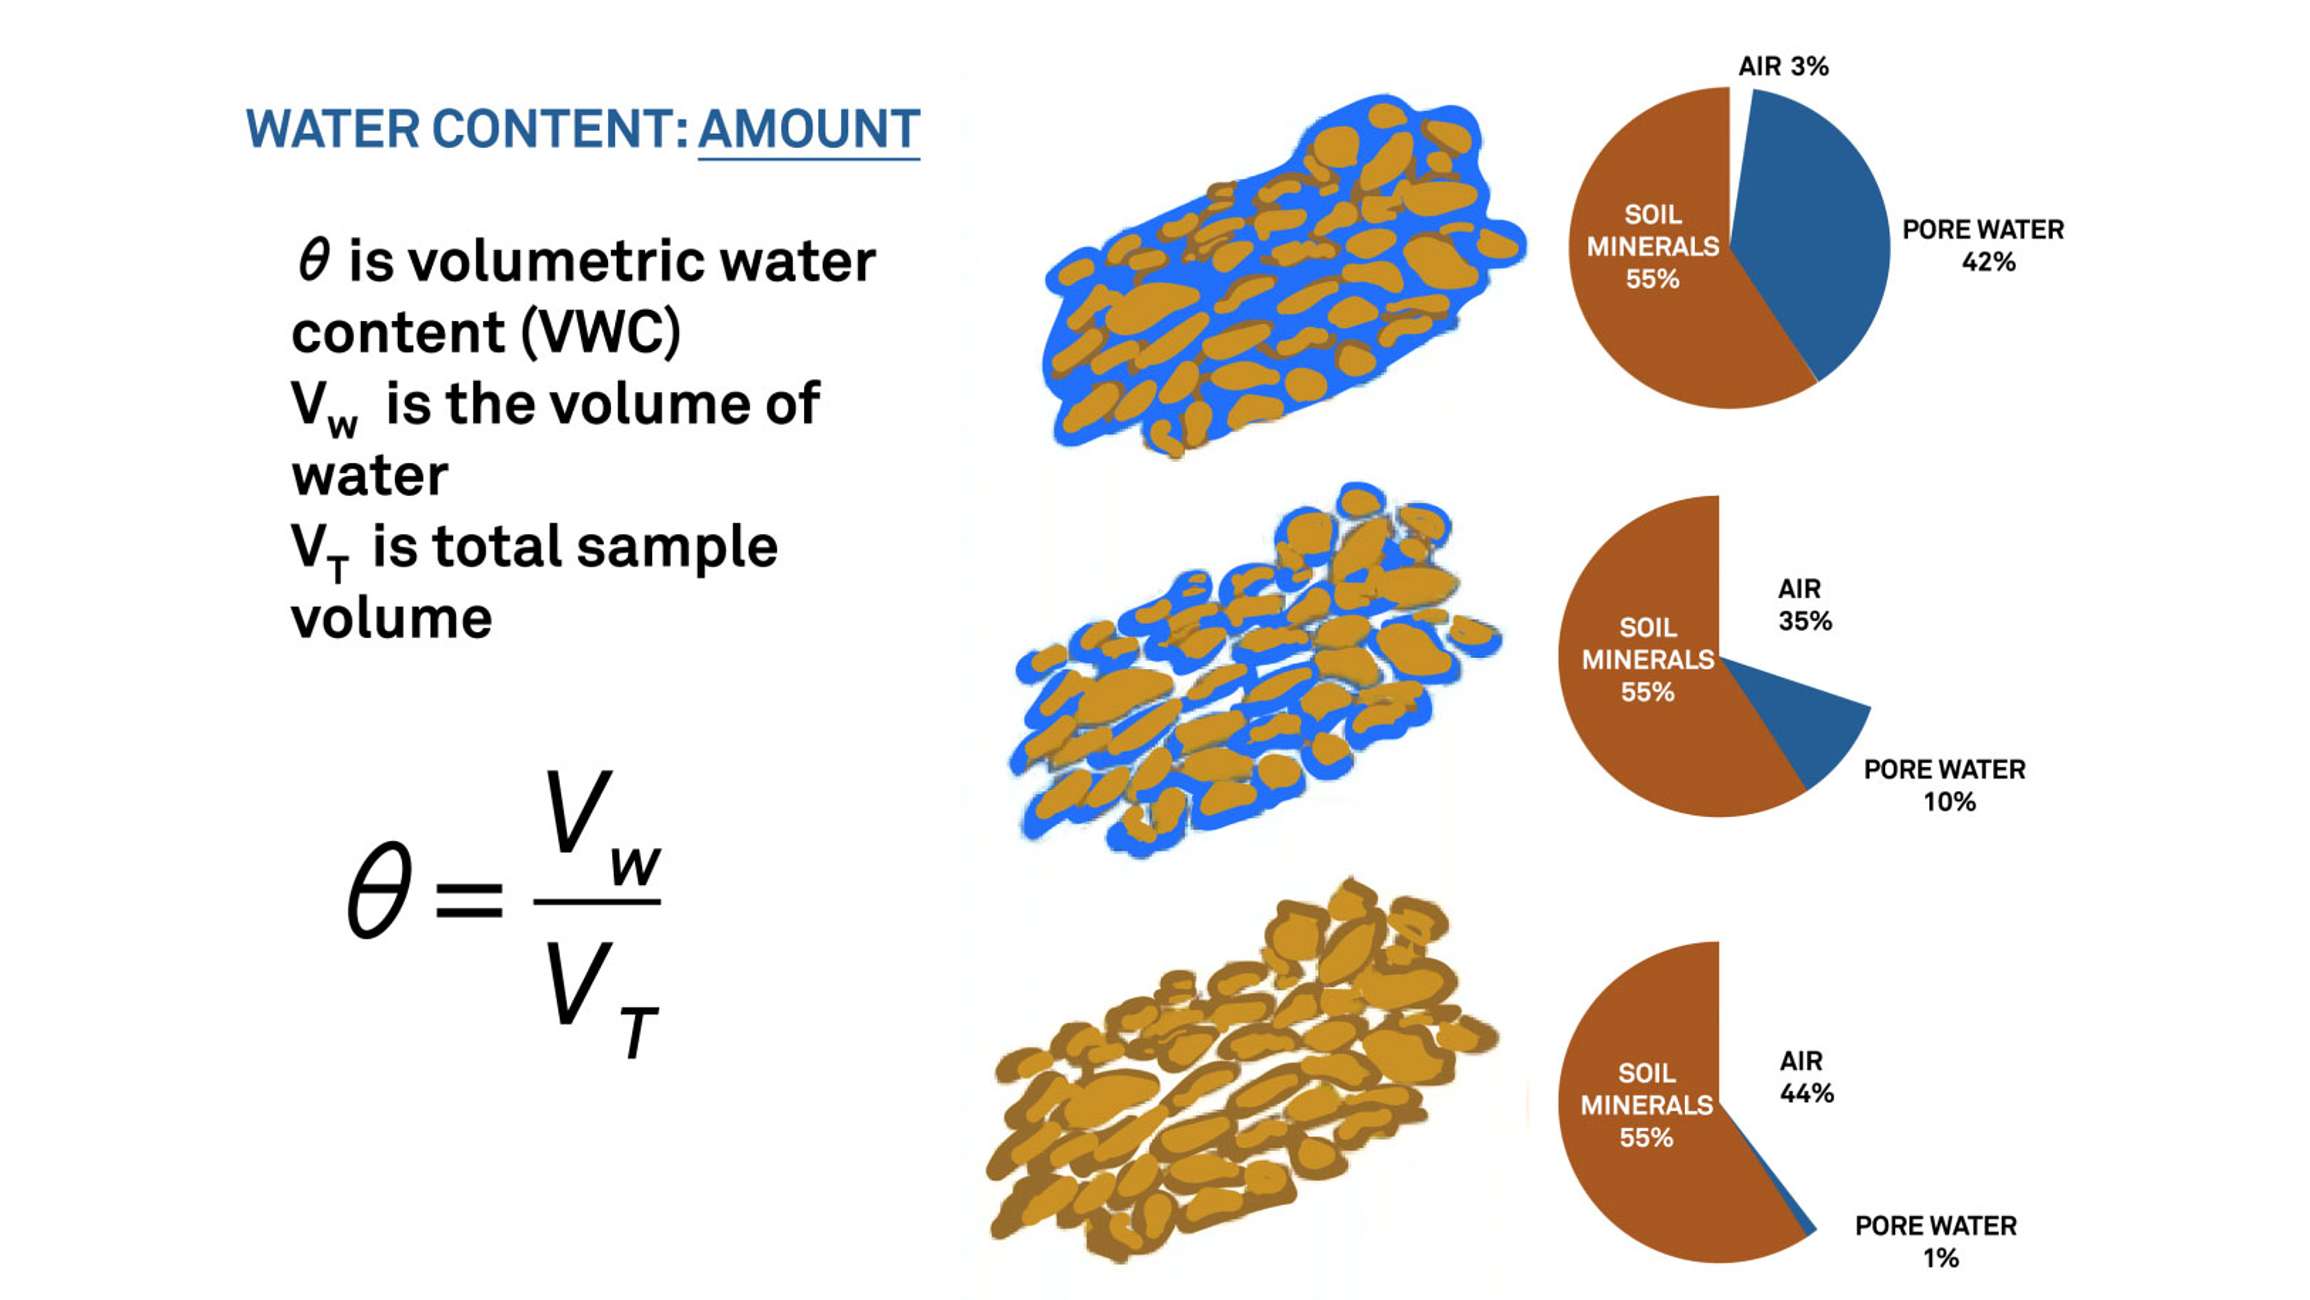
Water content refers to the amount of water in the soil by weight or by volume. The left side of Figure 1 below illustrates how to calculate soil water content by volume (volumetric water content or VWC). All in situ measurements are volume-based measurements.
Figure 1. Soil water content by volume
On the right of Figure 1 is a graphical representation of what VWC might look like in terms of the amount (percentage) of soil minerals, water, and air in the soil. If the percentage of soil water is what you’re interested in measuring, use more specific search terms such as “soil water content sensor” or “volumetric water content sensor”.
Water content is sometimes confused with water potential
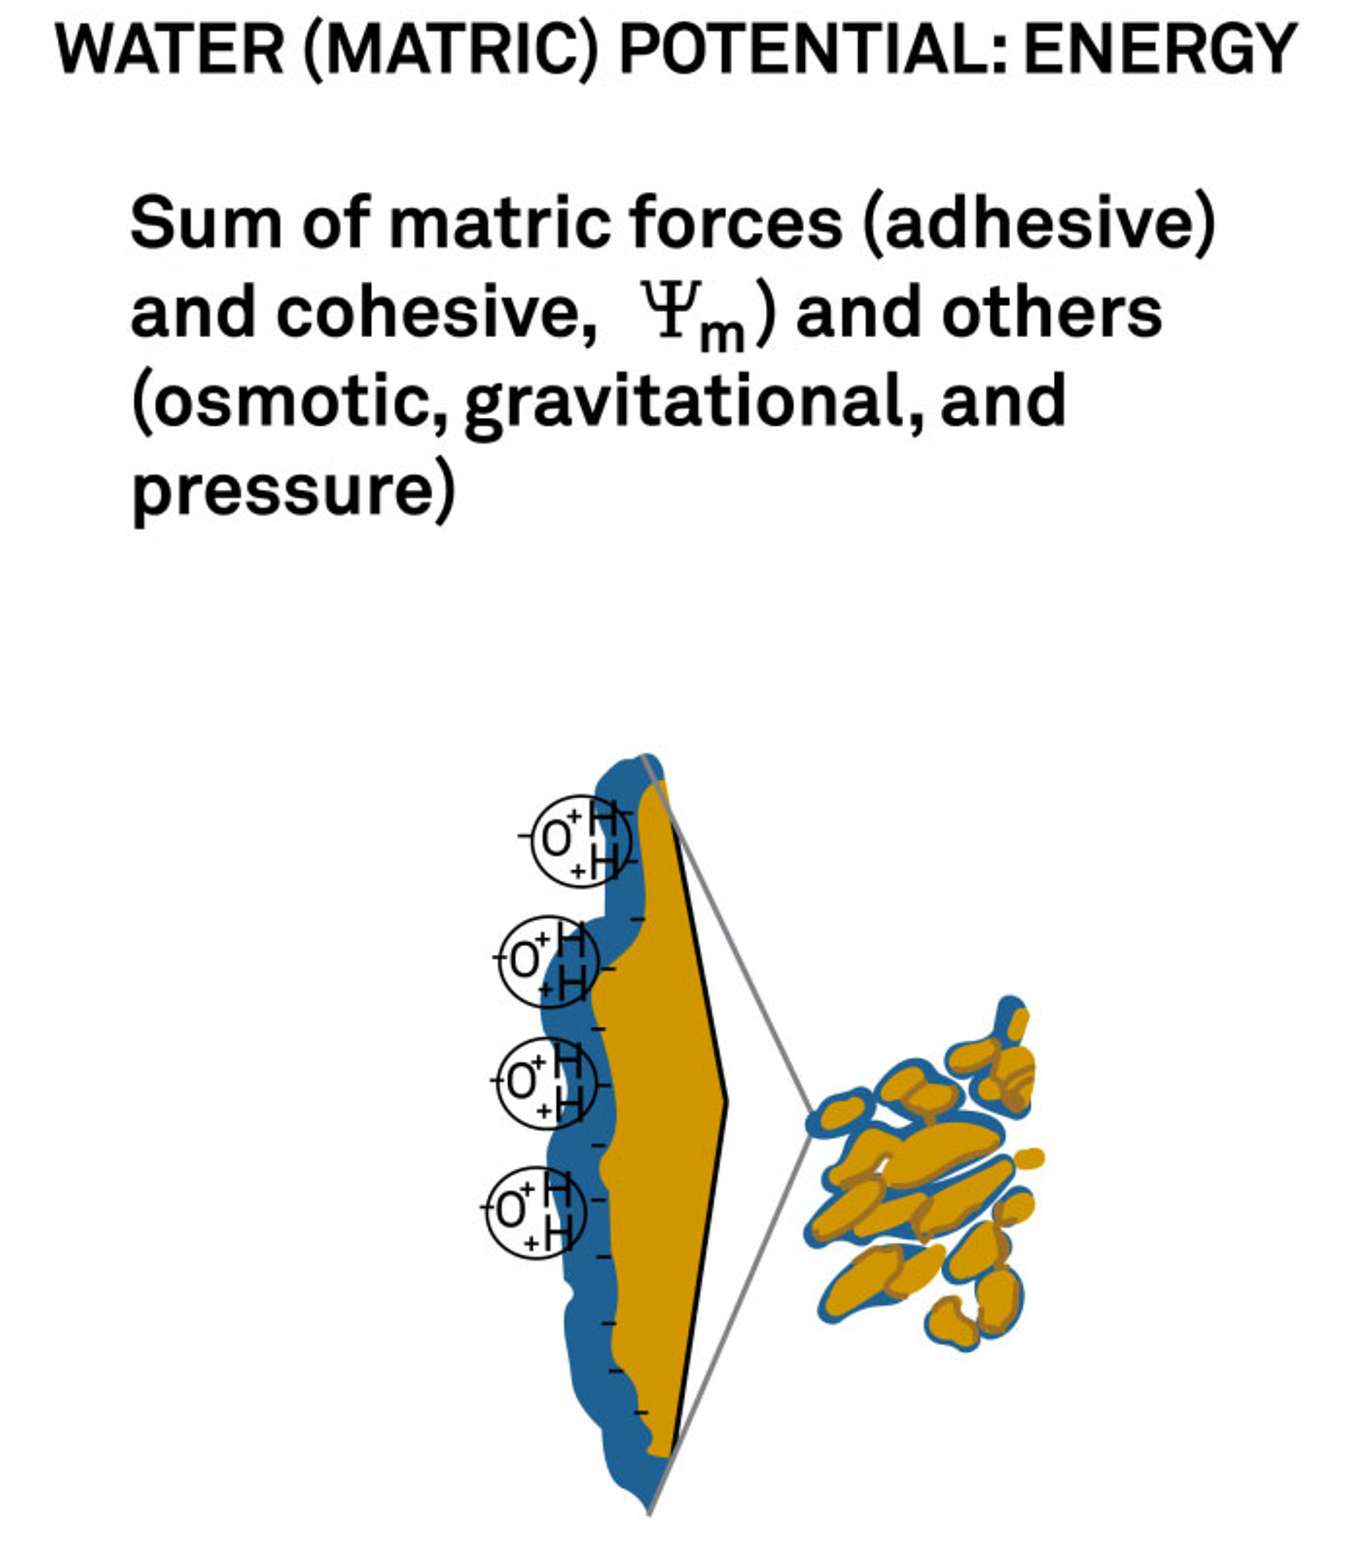
Water potential is different from water content. It refers to the energy state of water in the soil. Generally, this is dependent on the surface adhesion of water molecules onto soil particles.
Figure 2. The adhesive quality of water molecules attracts it to the surface of soil particles. More surface area per unit volume of soil tends to lower its energy state or water potential.
Figure 2 illustrates the boundary layer of water around soil particles (blue). This boundary layer becomes thinner as the soil water decreases. As this happens, the remaining water molecules are bound more tightly to the surface of the soil particles. This binding reduces the potential energy of the water and makes it less available for plants or movement. If you want to measure or predict plant water availability or soil water movement, use the terms “water potential sensor” or “matric potential sensor”.
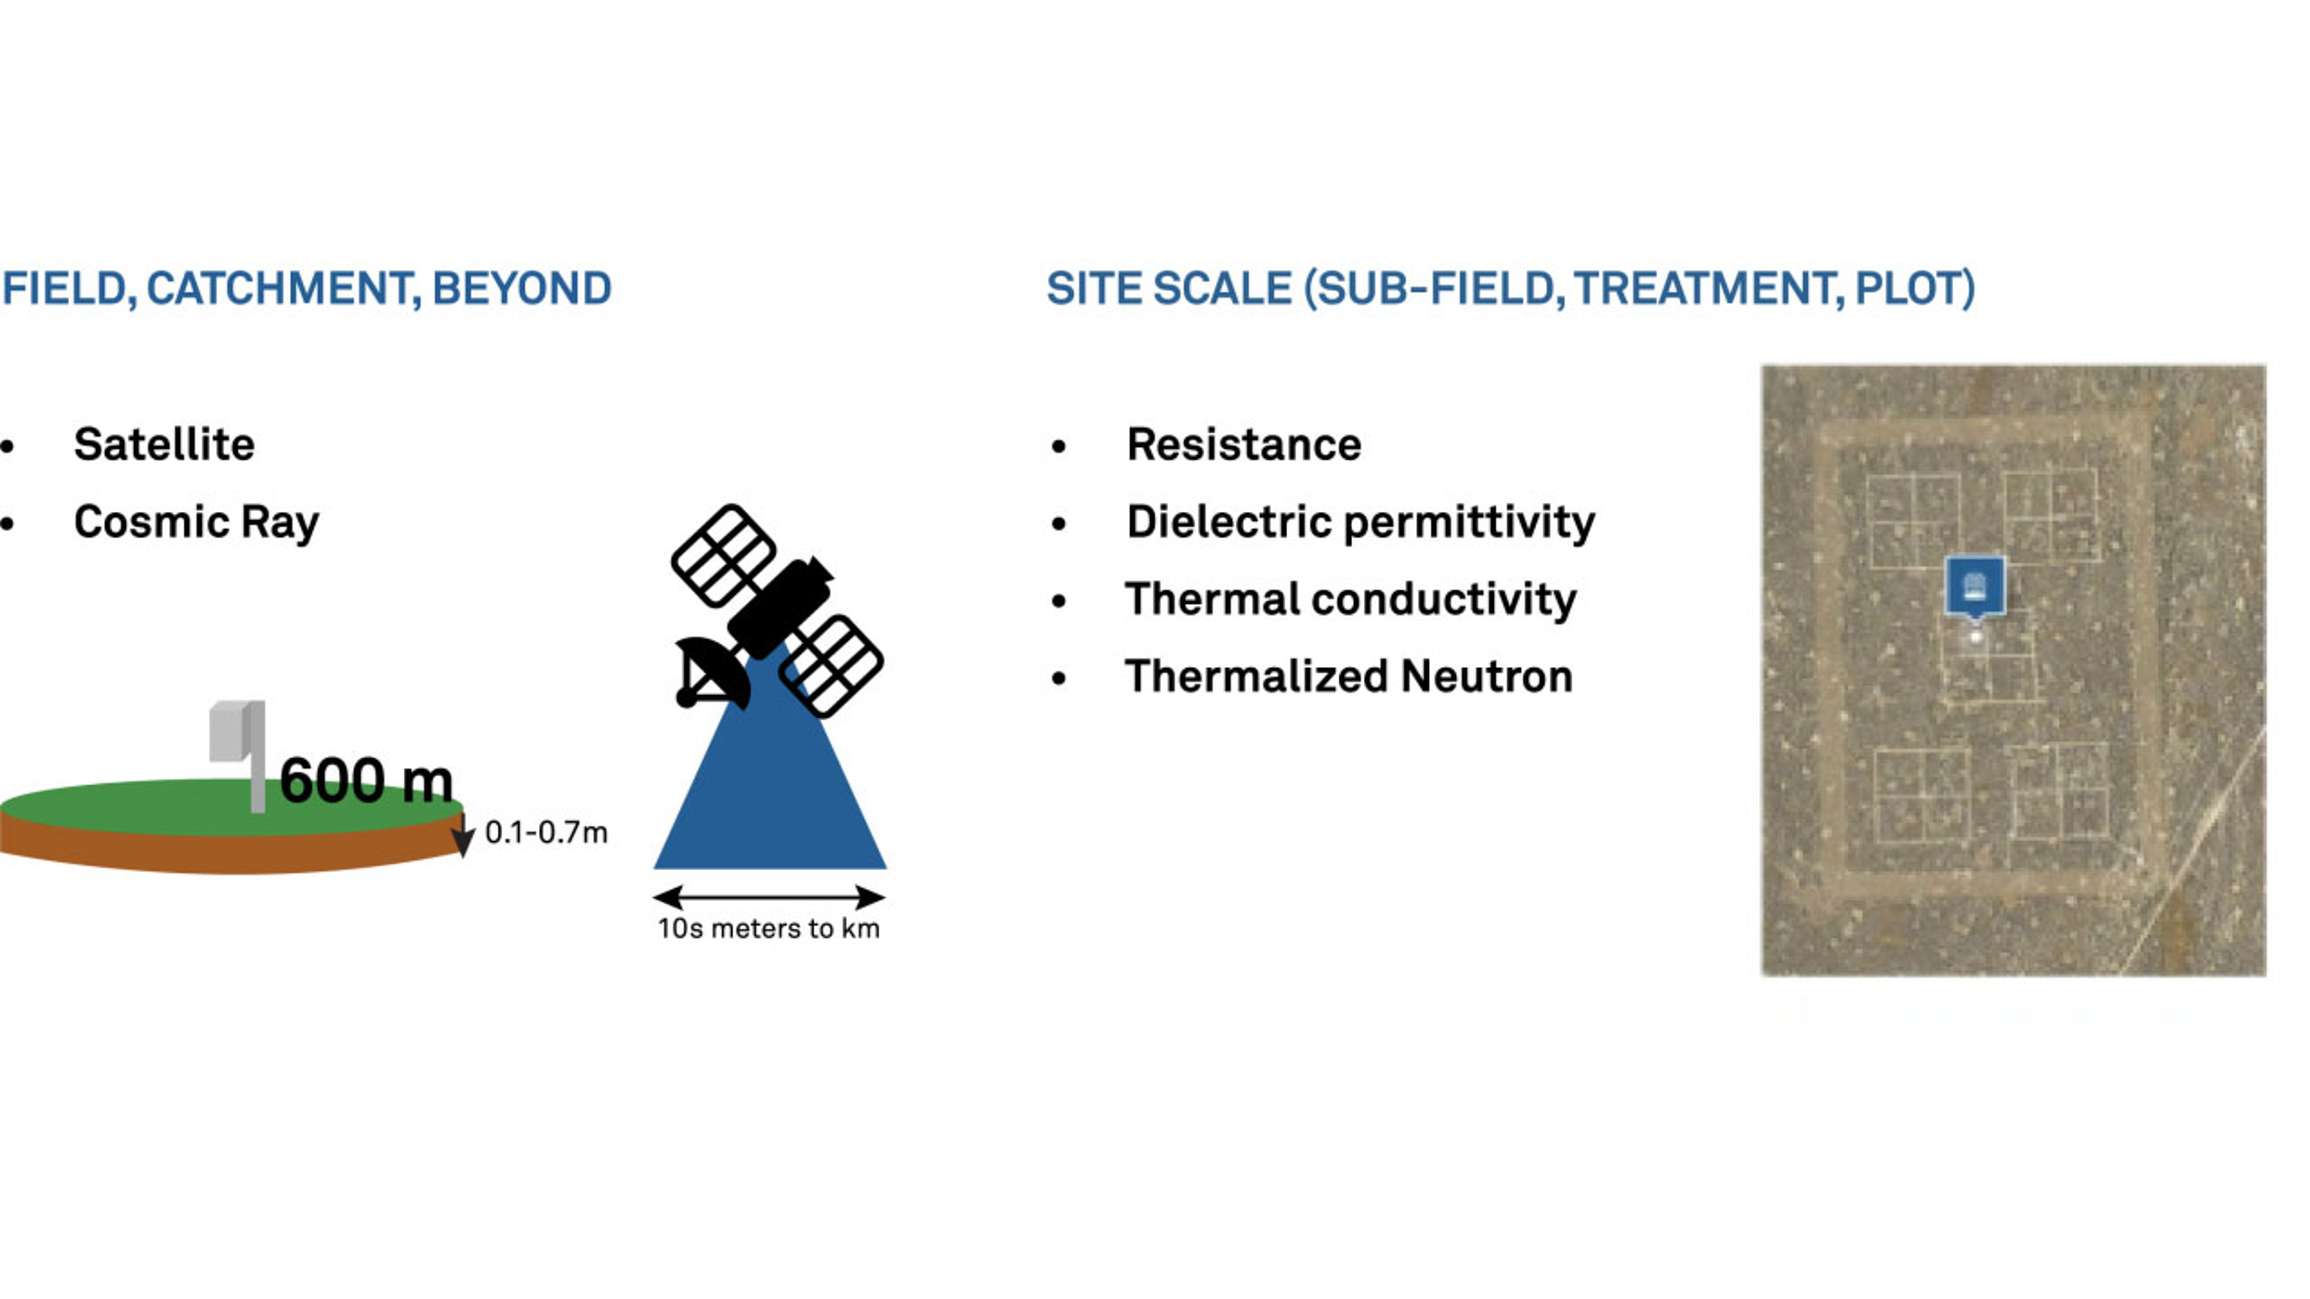
Soil water content can be measured at a field, catchment, or continental scale using satellite-based technology. It can also be measured over large areas using down-welling cosmic neutrons.
Figure 3. Water content can be measured at different scales
All of these techniques are extremely useful, but in this article, we’ll compare in situ techniques that measure at a single location in a plot, treatment, or field. These include four basic methods:
Resistance
Dielectric permittivity (TDR, FDR, Capacitance)
Thermal conductivity
Thermalized neutrons
By far, the most common of these sensing techniques are resistance and dielectric (TDR sensors, FDR sensors, capacitance sensors), and these will be the focus of our comparison. However, you can find information on these and other methods in the webinar below: Soil moisture 201—Water Content Measurements, Methods, and Applications.
When choosing a soil moisture sensing method, it’s important to consider the application. For example, at a research site in Rush Valley, Utah, one researcher’s challenge was comparing water use between treatments where precipitation, rodents, and prescribed burns were changing. Selecting the right technology was critical to showing the effect of these treatments on the balance of native to invasive species in the presence of altered precipitation regimes.
Why resistance soil moisture sensors are not research grade
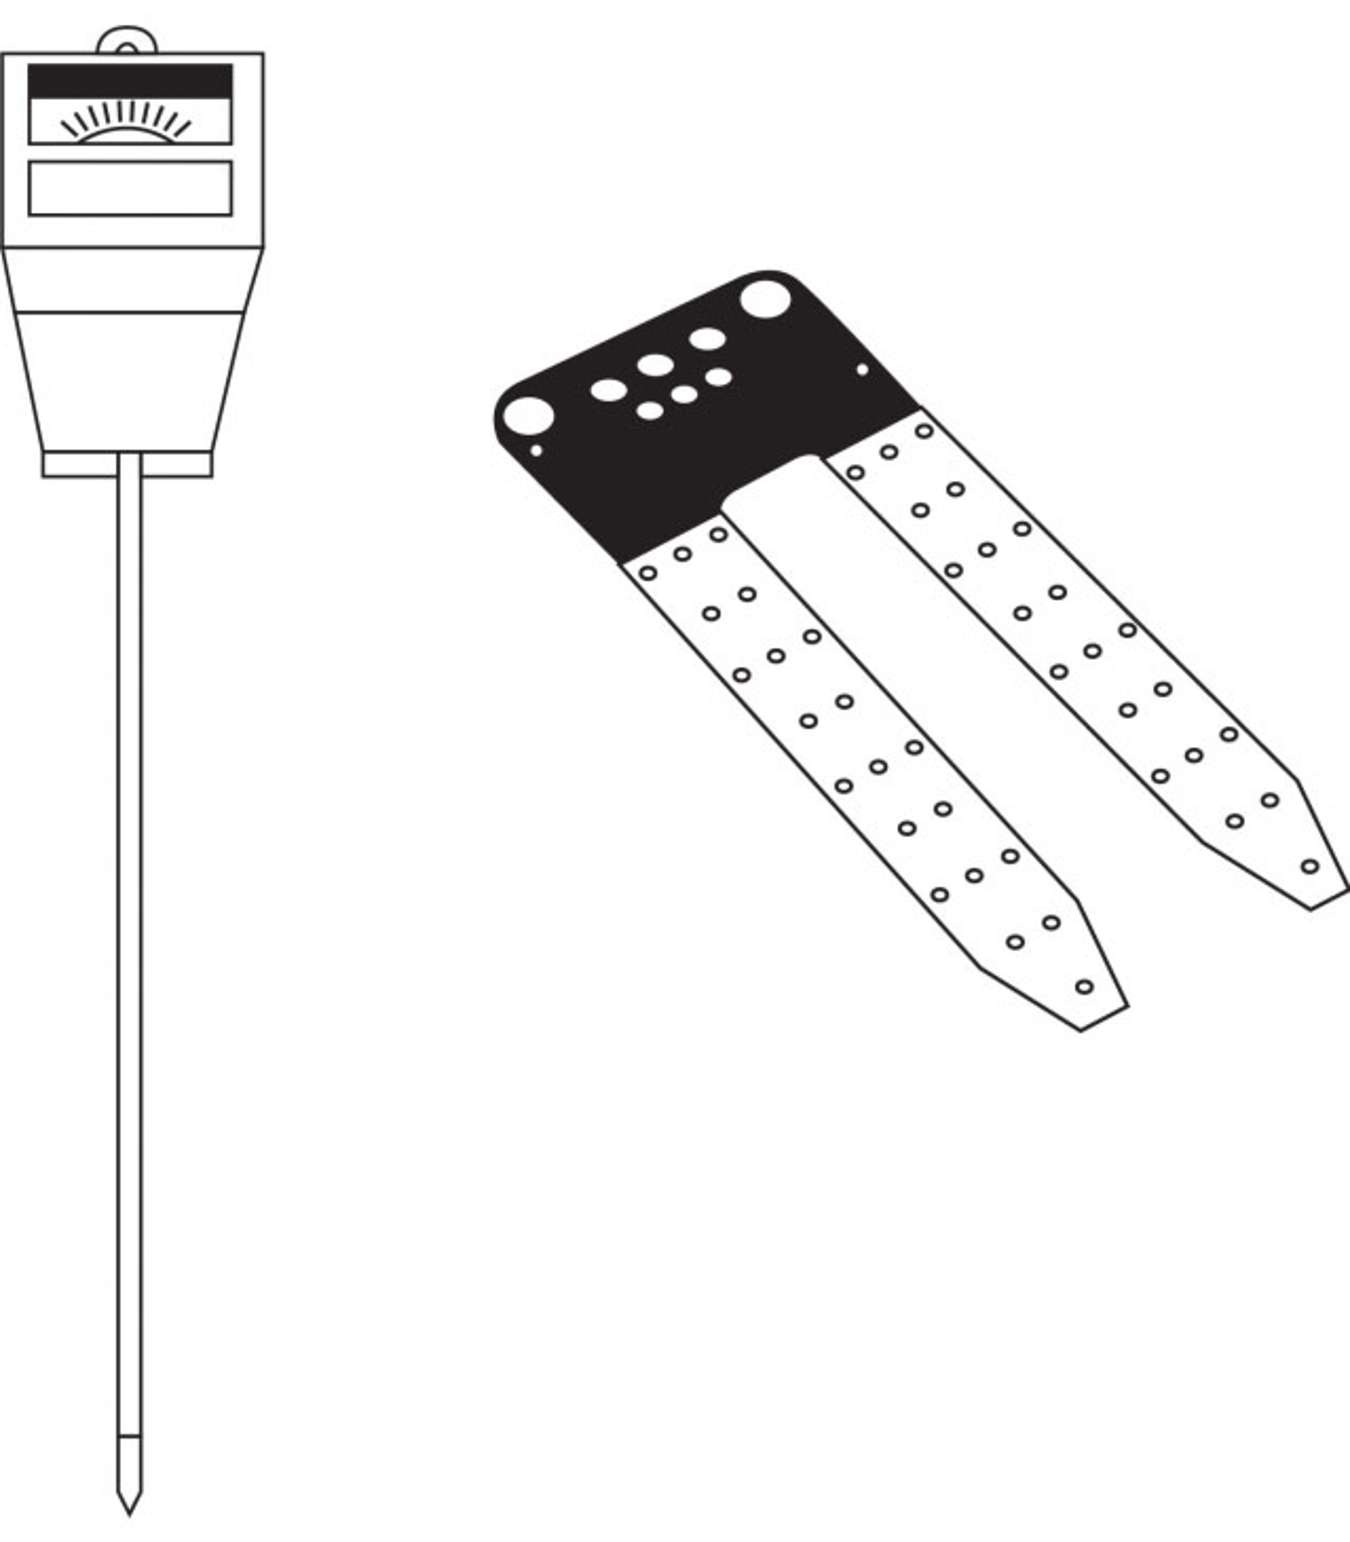
Figure 4 is an example of two soil moisture sensors found using a Google search. Both of these sensors measure the soil water content percentage by creating a voltage difference across two electrodes, allowing a small amount of current to flow between them and outputting a value of resistance or electrical conductivity.
Figure 4. Resistance sensors
Since water is a very poor conductor, it is the ions in the water that carry the current from one electrode to the other. In theory, the idea is a good one; it makes sense that the resistance will go down as the amount of water in soil increases. However, in practice, there are challenges associated with the assumptions behind this method. Here’s why:
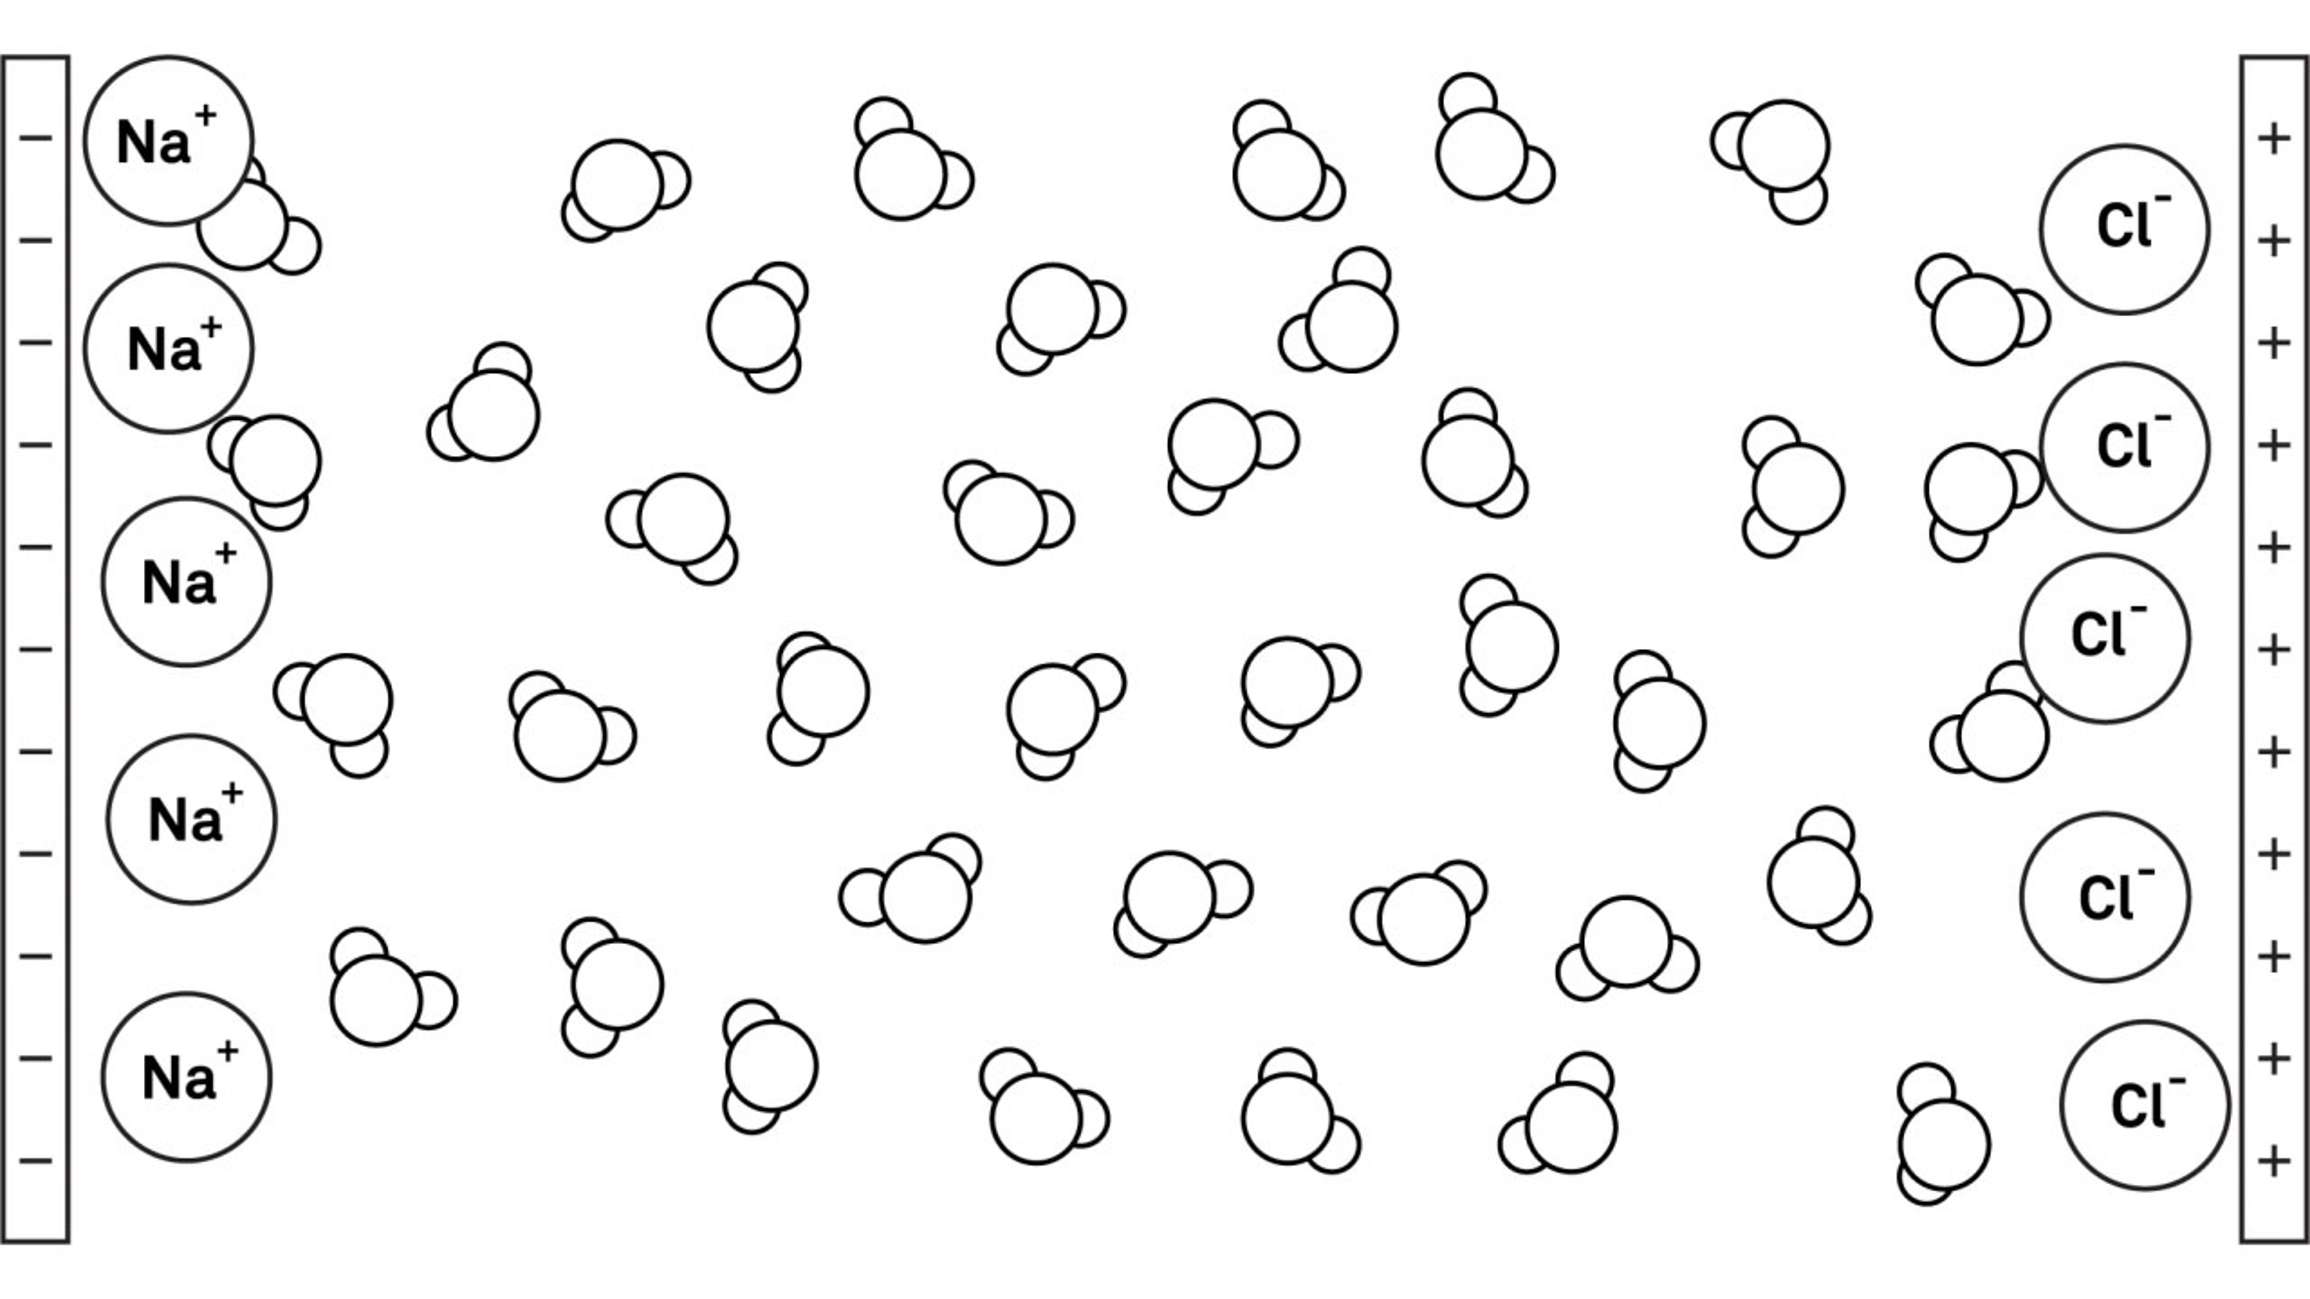
Figure 5. The diagram shows two electrodes with a voltage difference between them. The resistance sensors allow a small amount of current to flow between the electrodes, carried by the positively and negatively charged ions (in this case, NaCl)
Figure 5 illustrates what happens when a positive and a negative plate are charged and the ions move in the soil. For the resistance method to work, one critical assumption is that the number of ions in the soil remains relatively constant. If the number of ions in the soil is not constant or we use the sensor in a different soil, accuracy becomes impossible because as the number of ions in the pore water changes, the ability for current to flow is altered, even when the amount of water has not changed.
This idea can be illustrated using a simple example. For a sensor to be used for more than wet/dry measurements, it needs to have a calibration that relates the sensor output (in this case, its resistance or its simple inverse: electrical conductivity) to volumetric water content.
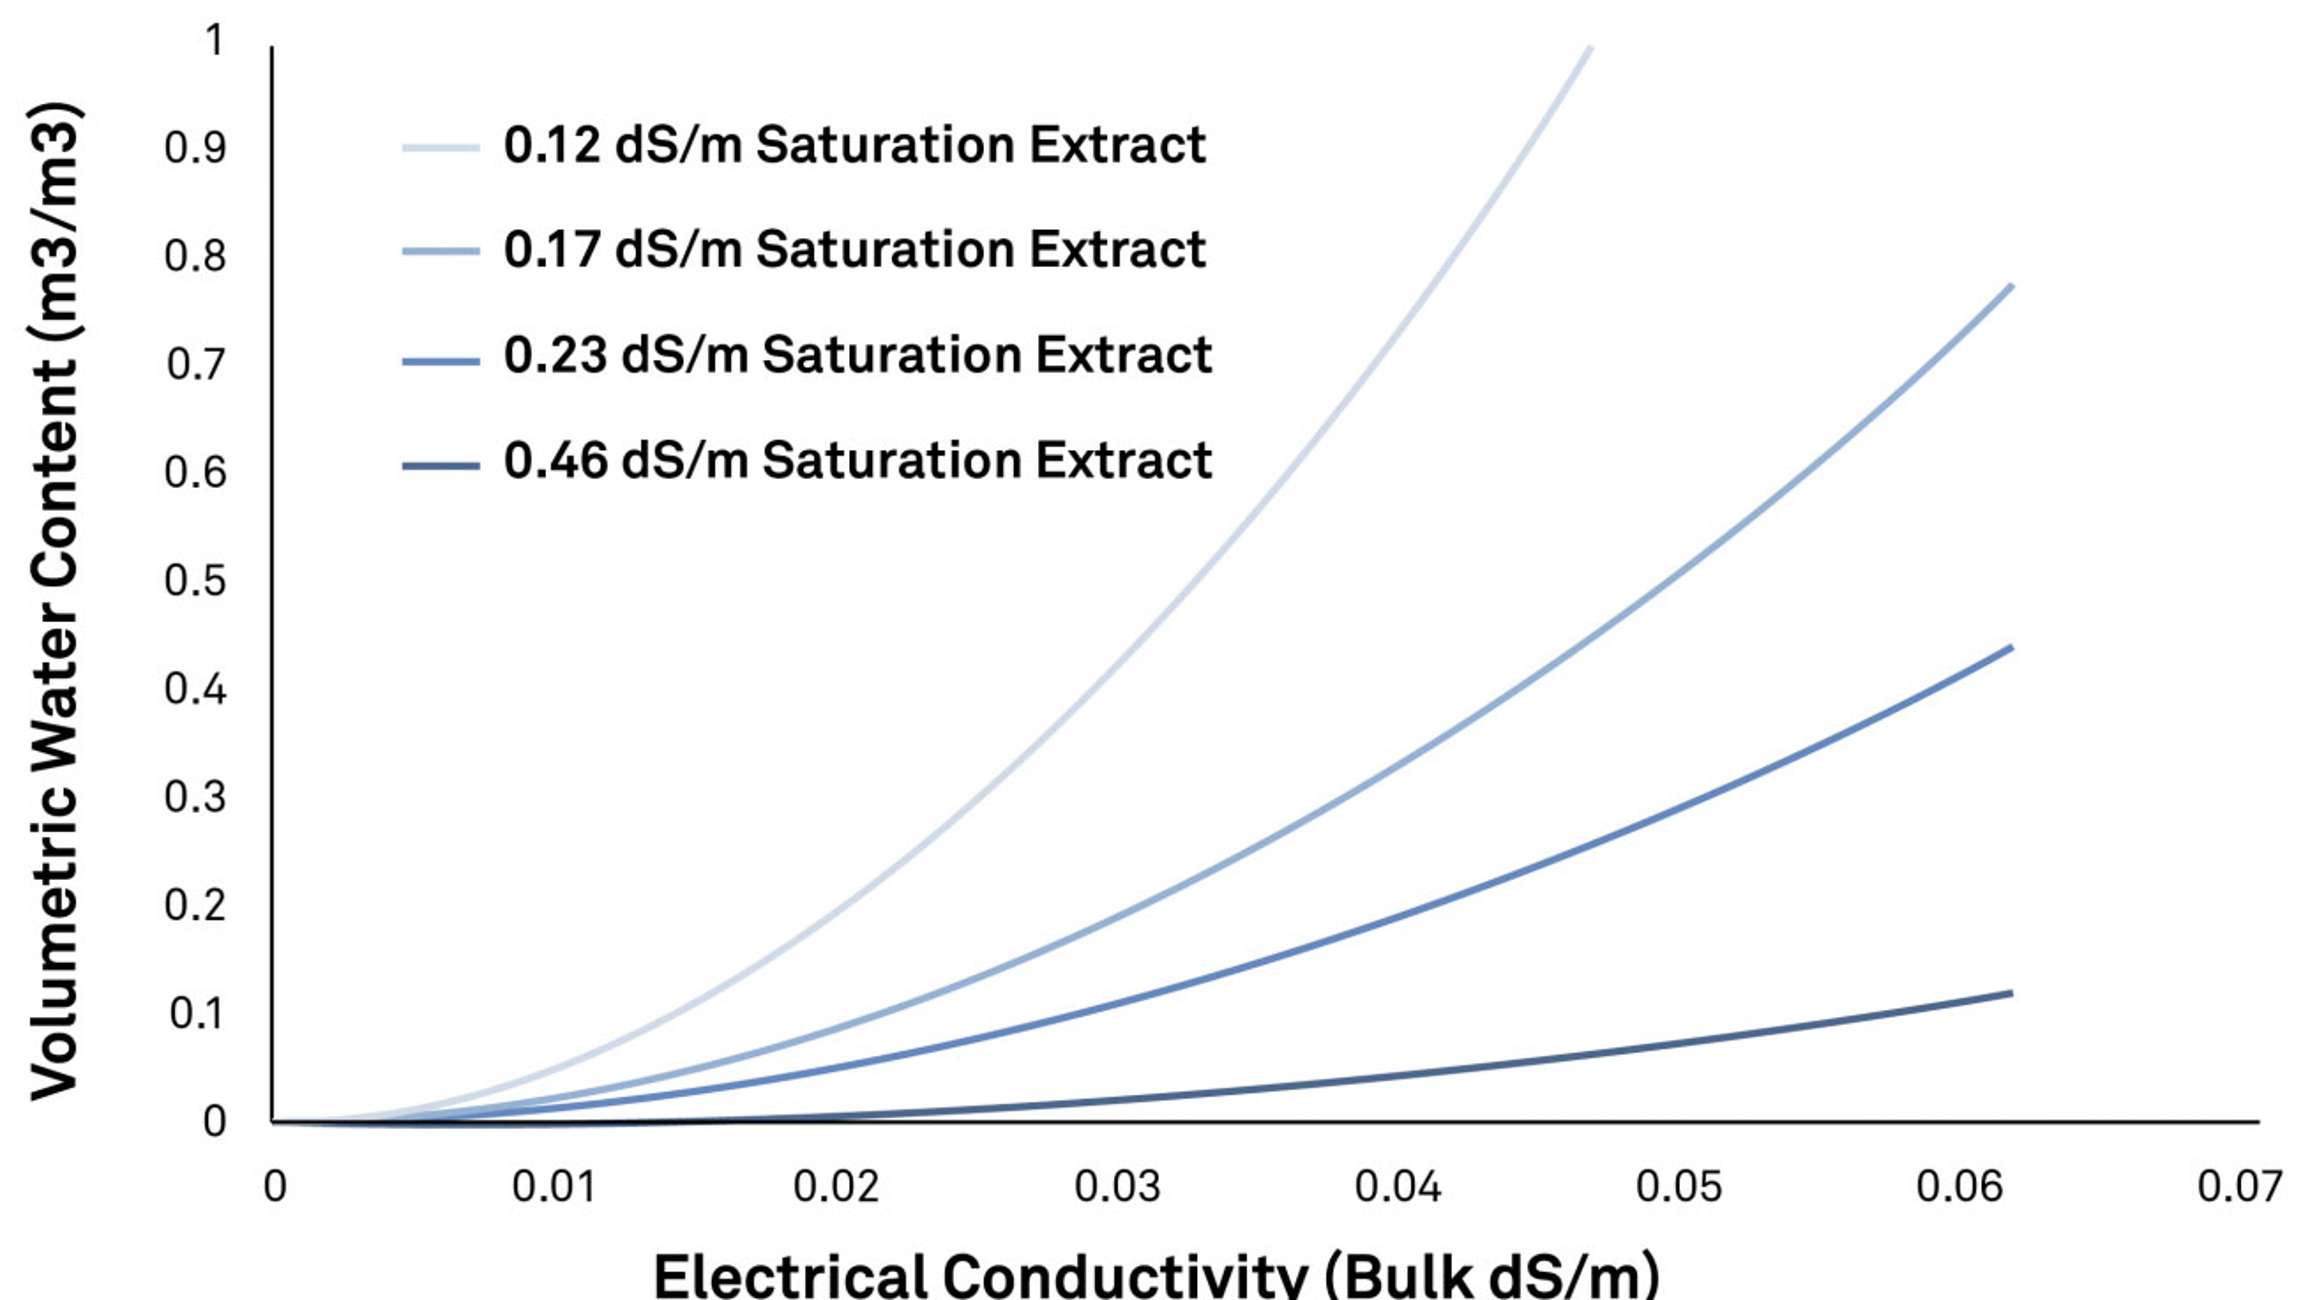
Figure 6. The calibration of a resistance sensor at four different soil saturation extract electrical conductivities (ECe). For a modest change in ECe, the sensor calibration changes by ten times.
Figure 6 is a simple model of saturation extract electrical conductivity (the electrical conductivity of water after it’s pulled out of a saturated soil). It shows that the sensor calibration can change more than an order of magnitude.
So, although resistance sensors are inexpensive, react to changes in water content, and are simple to integrate into DIY projects, their only real use is for home gardening and science fair projects. In any scientific pursuit, they simply can’t produce reliable volumetric water content measurements.
Table 1. Resistance sensor overview and usage
Resistance Sensors
Overview
-Incredibly cheap
-React to changes in water amount
-Simple to integrate
Usage
-Home/science fair projects
Dielectric sensors (TDR, FDR, capacitance): a more effective approach
Dielectric sensors (TDR, FDR, capacitance types) are a general category of sensors that measure the charge-storing capacity of the soil. This charge-storage approach is much more effective than a resistance approach, and here’s why.
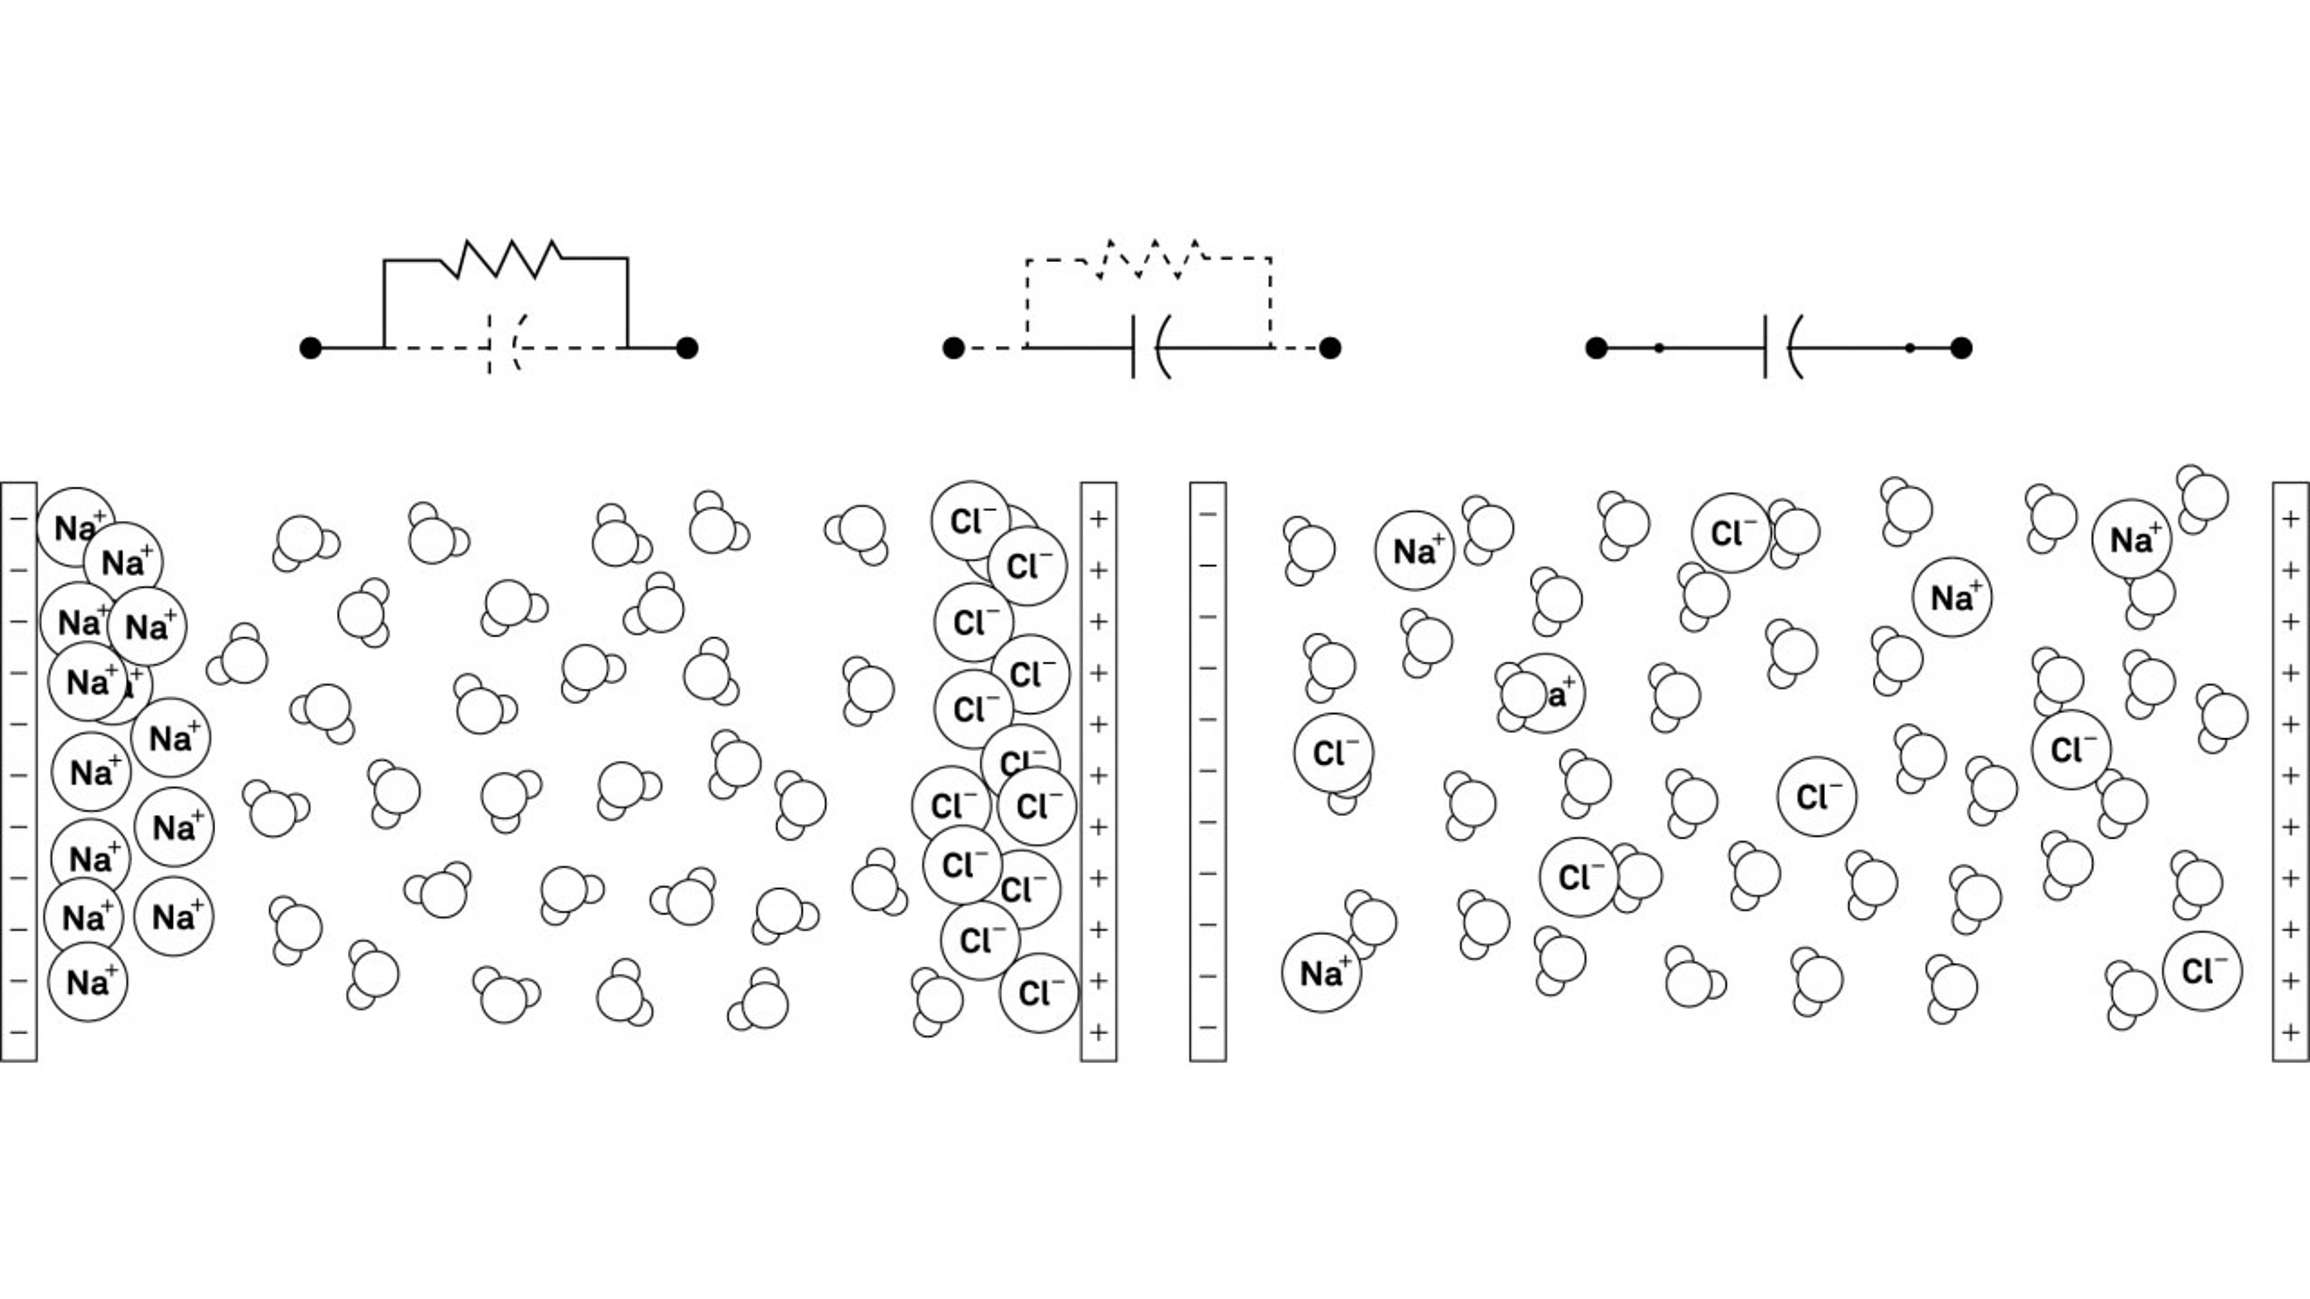
Figure 7. What happens to the ions with a resistance sensor (left) and a dielectric sensor (TDR, FDR, Capacitance) (right), plus electrical circuit diagrams of what a resistor (top left) and capacitor (top right) look like
On the left of Figure 7 is a diagram of what happens to the ions with a resistance sensor. On the right is what happens to the ions with a dielectric sensor (TDR, FDR capacitance). The ideal dielectric sensor electrical circuit on the right is one that simply acts to polarize water molecules between two electrodes. The water molecules align in that field very briefly, so it stores a small amount of charge without causing the salt ions to polarize. This ideal measurement is sensitive to changes in the amount of water but not to changes in the amount of salt.
Above the ion drawings in Figure 7, are electrical circuit diagrams of what a resistor (left) and capacitor (right) look like. Some dielectric measurements act more like the middle circuit diagram, where they incorporate some resistance into the measurement and are somewhat sensitive to changes in salt concentration.
TDR sensors, FDR sensors, capacitance sensors: Why they work
So why is dielectric (TDR, FDR, capacitance) an effective measurement of water in a porous soil matrix?
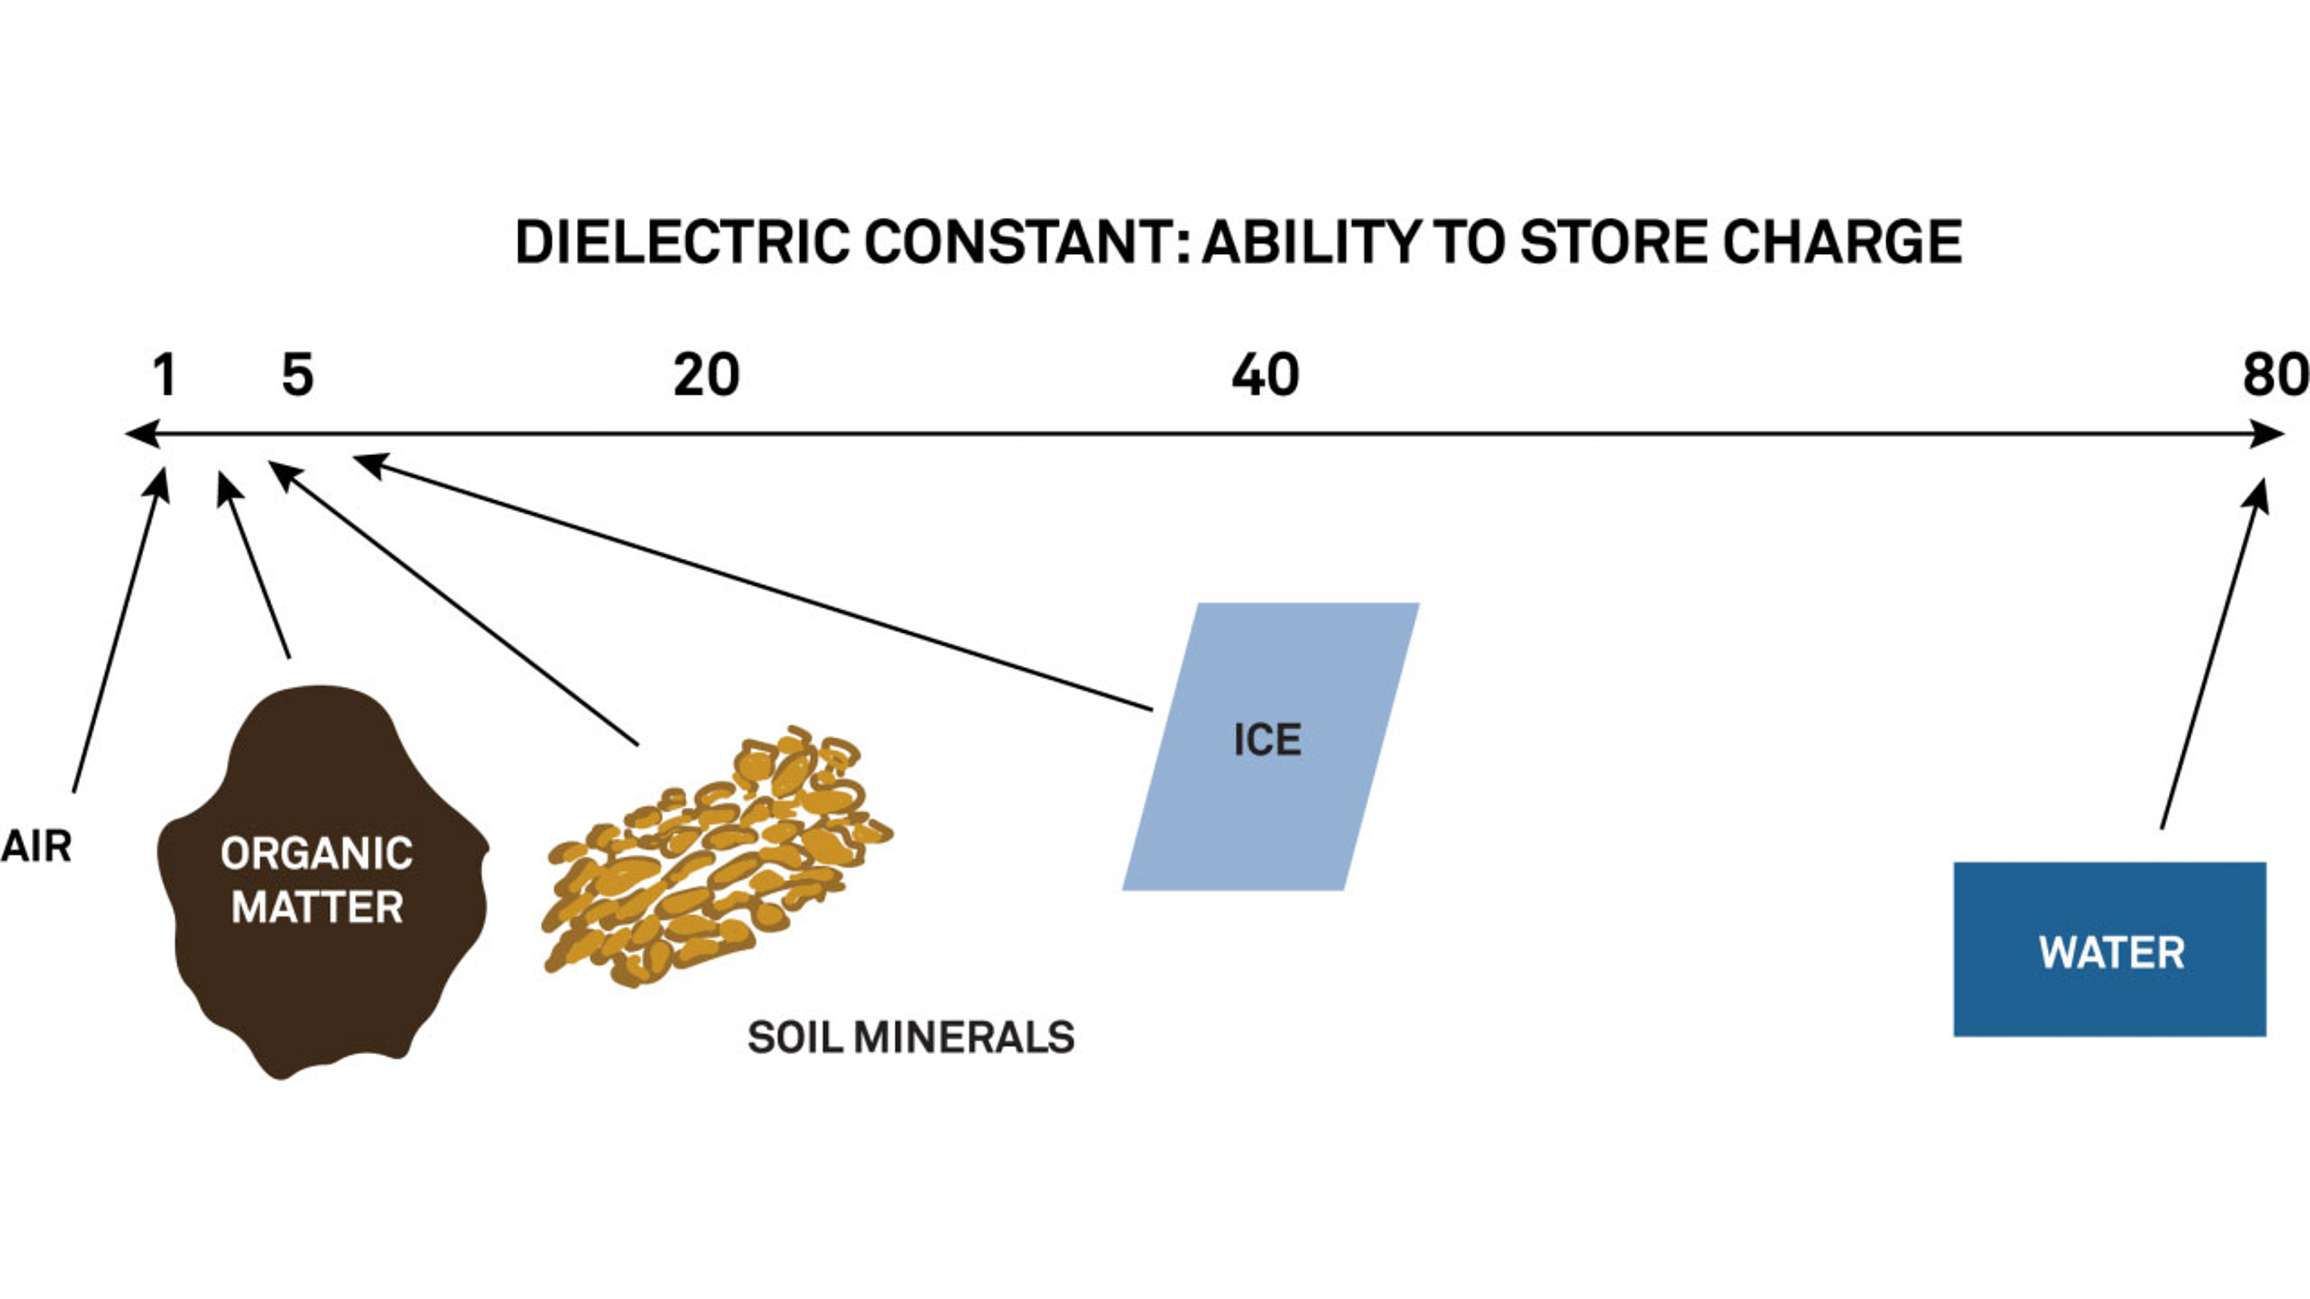
Figure 8. Solids, liquids, and gases all have the capacity to store charge, called their dielectric constant. It is specific to the material and varies over a wide range as shown here. It also changes with the frequency with which it is measured, as will be discussed later.
Each material in soil has a unique ability to store electrical charge, referred to as its dielectric constant. The dielectric scale arbitrarily assigns a value of 1 to air and then relates other materials to that value. Soil is a mixture of solids, liquids, and gases. Each of these has a different dielectric, but in general, they all have low dielectric values compared to water. Thus, when the charge-storing capacity of the soil is measured by a dielectric sensor, water and air are the only things that change significantly by volume, so we can relate that to volumetric water content.
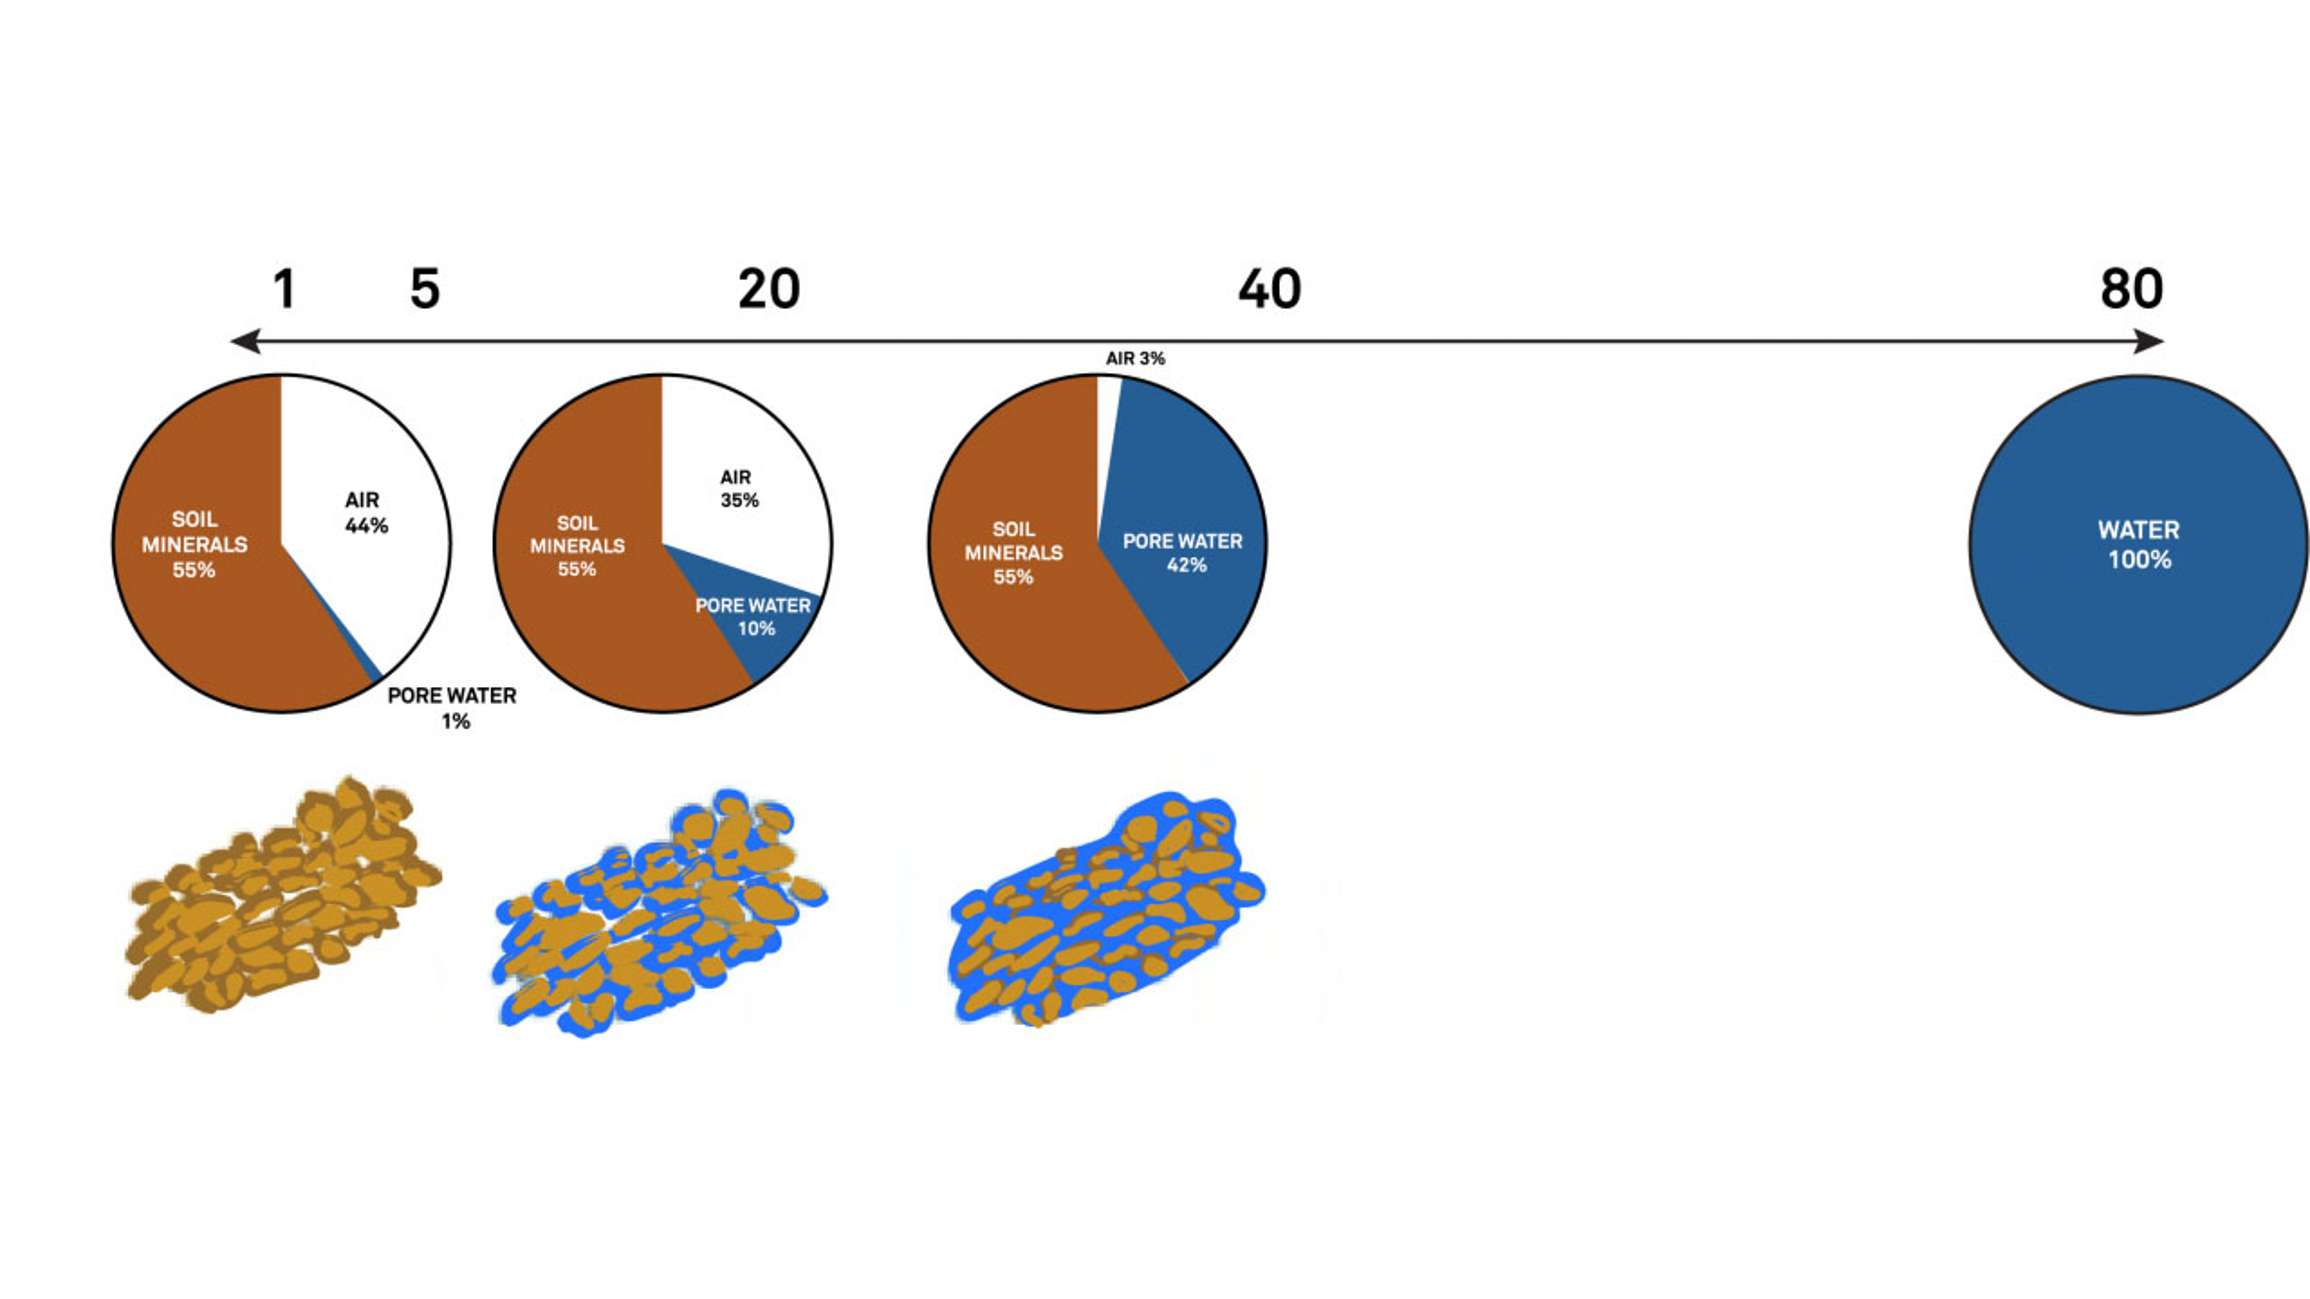
Figure 9. Soil is a mixture of solids, liquids, and gases. In the same soil, the volume of solids (soil minerals) will not change, while the fraction of water and air changes considerably. Here, volume fractions of water in soil are shown with the approximate soil dielectric. Pure water is shown for comparison purposes.
Figure 9 is the same scale showing volume percentages of different soil mixtures equated to dielectric values with pure water all the way to the right (obviously this would not happen in soil because there would be no minerals). Since minerals are often approximately 50% of the total soil volume, the actual dielectric range of mineral soil is usually between 2 and 30, though that’s just a general rule, and it can change in specific soil situations.
Obviously, one key characteristic of a useful soil water content sensor is an accurate measurement of volumetric water content.
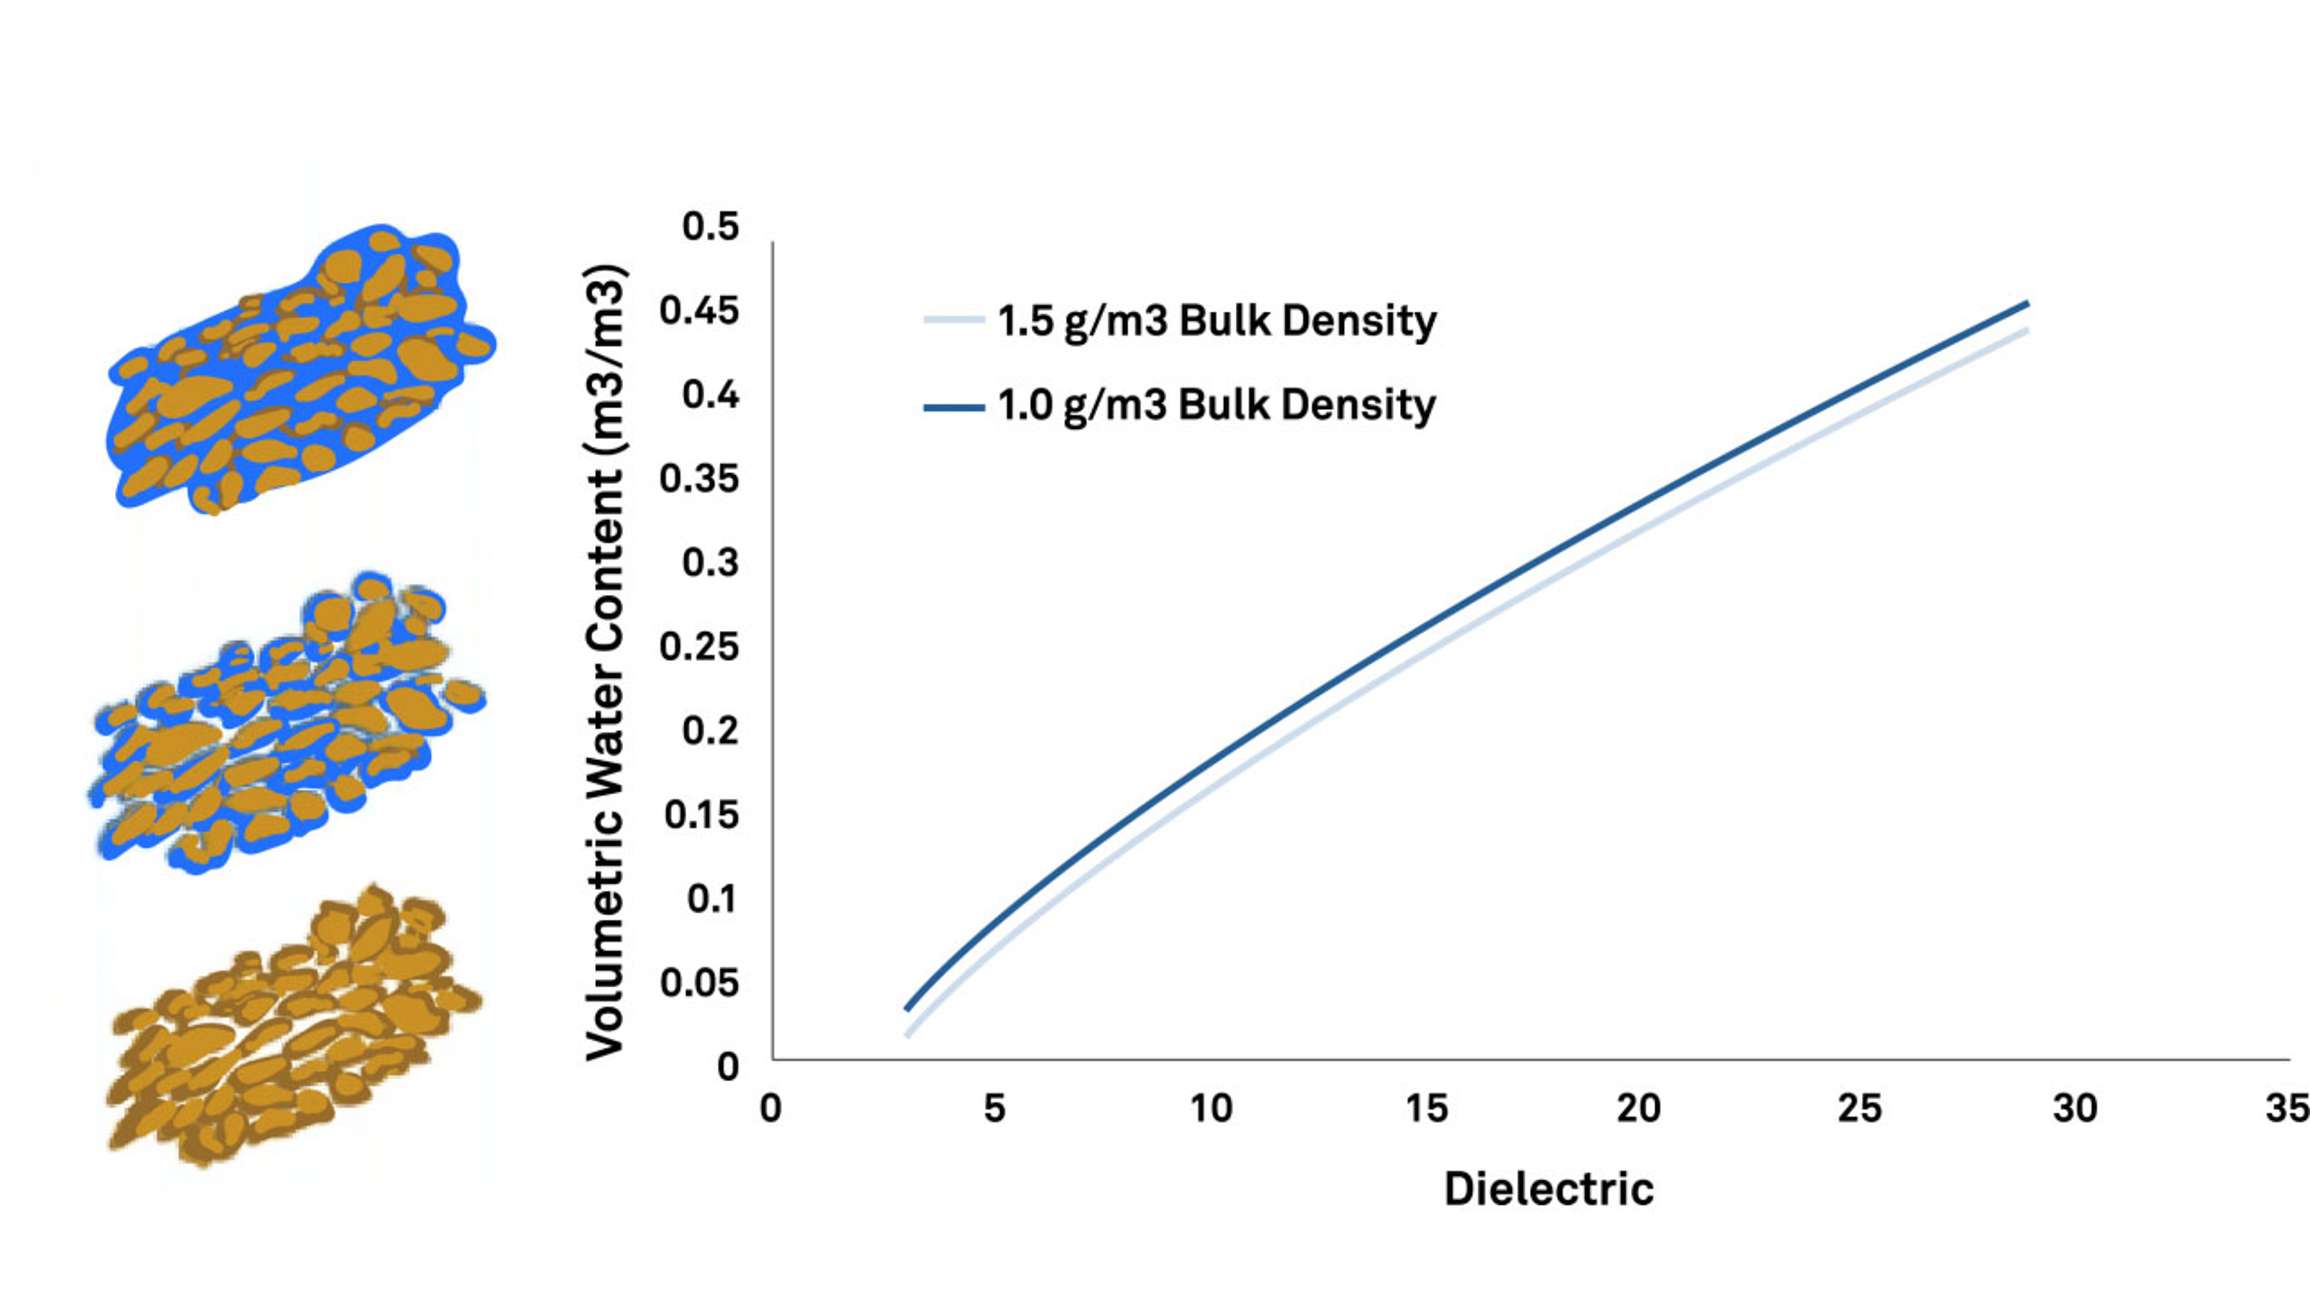
Figure 10. A predicted relationship between soil dielectric and volumetric water content using Topp et al. (1980). The two lines show calibration changes due to soil bulk density differences.
Figure 10 is a graph of a relationship between the dielectric of the soil and its volumetric water content. Like resistance, dielectric sensors are not perfect at predicting the volumetric water content. However, with these sensors, things that affect performance do so with a much smaller effect. In this graph with the dielectric on the x-axis and the volumetric water content on the y-axis, note how the difference in soil bulk density affects the calibration. The effect is there, but it’s relatively minor. Bulk density is not the only thing that will change the calibration, things like soil type, salinity, clay percentage, and sensor-to-soil contact can also affect accuracy, among other things. However, many of the high-quality sensors available have developed technology to mitigate most of these challenges. It’s not possible to avoid these issues completely, but it is possible to minimize them.
TEROS 12 soil water content sensor
Dielectric sensors do not all perform at the same level
Dielectric measurement techniques (TDR sensor, FDR sensor, capacitance sensors)are not all created equal. In fact, some can act more like resistance sensors depending on their measurement frequency and circuit design. Successfully polarizing water molecules while avoiding polarizing dissolved ions depends on how quickly this polarization happens, or the measurement frequency.
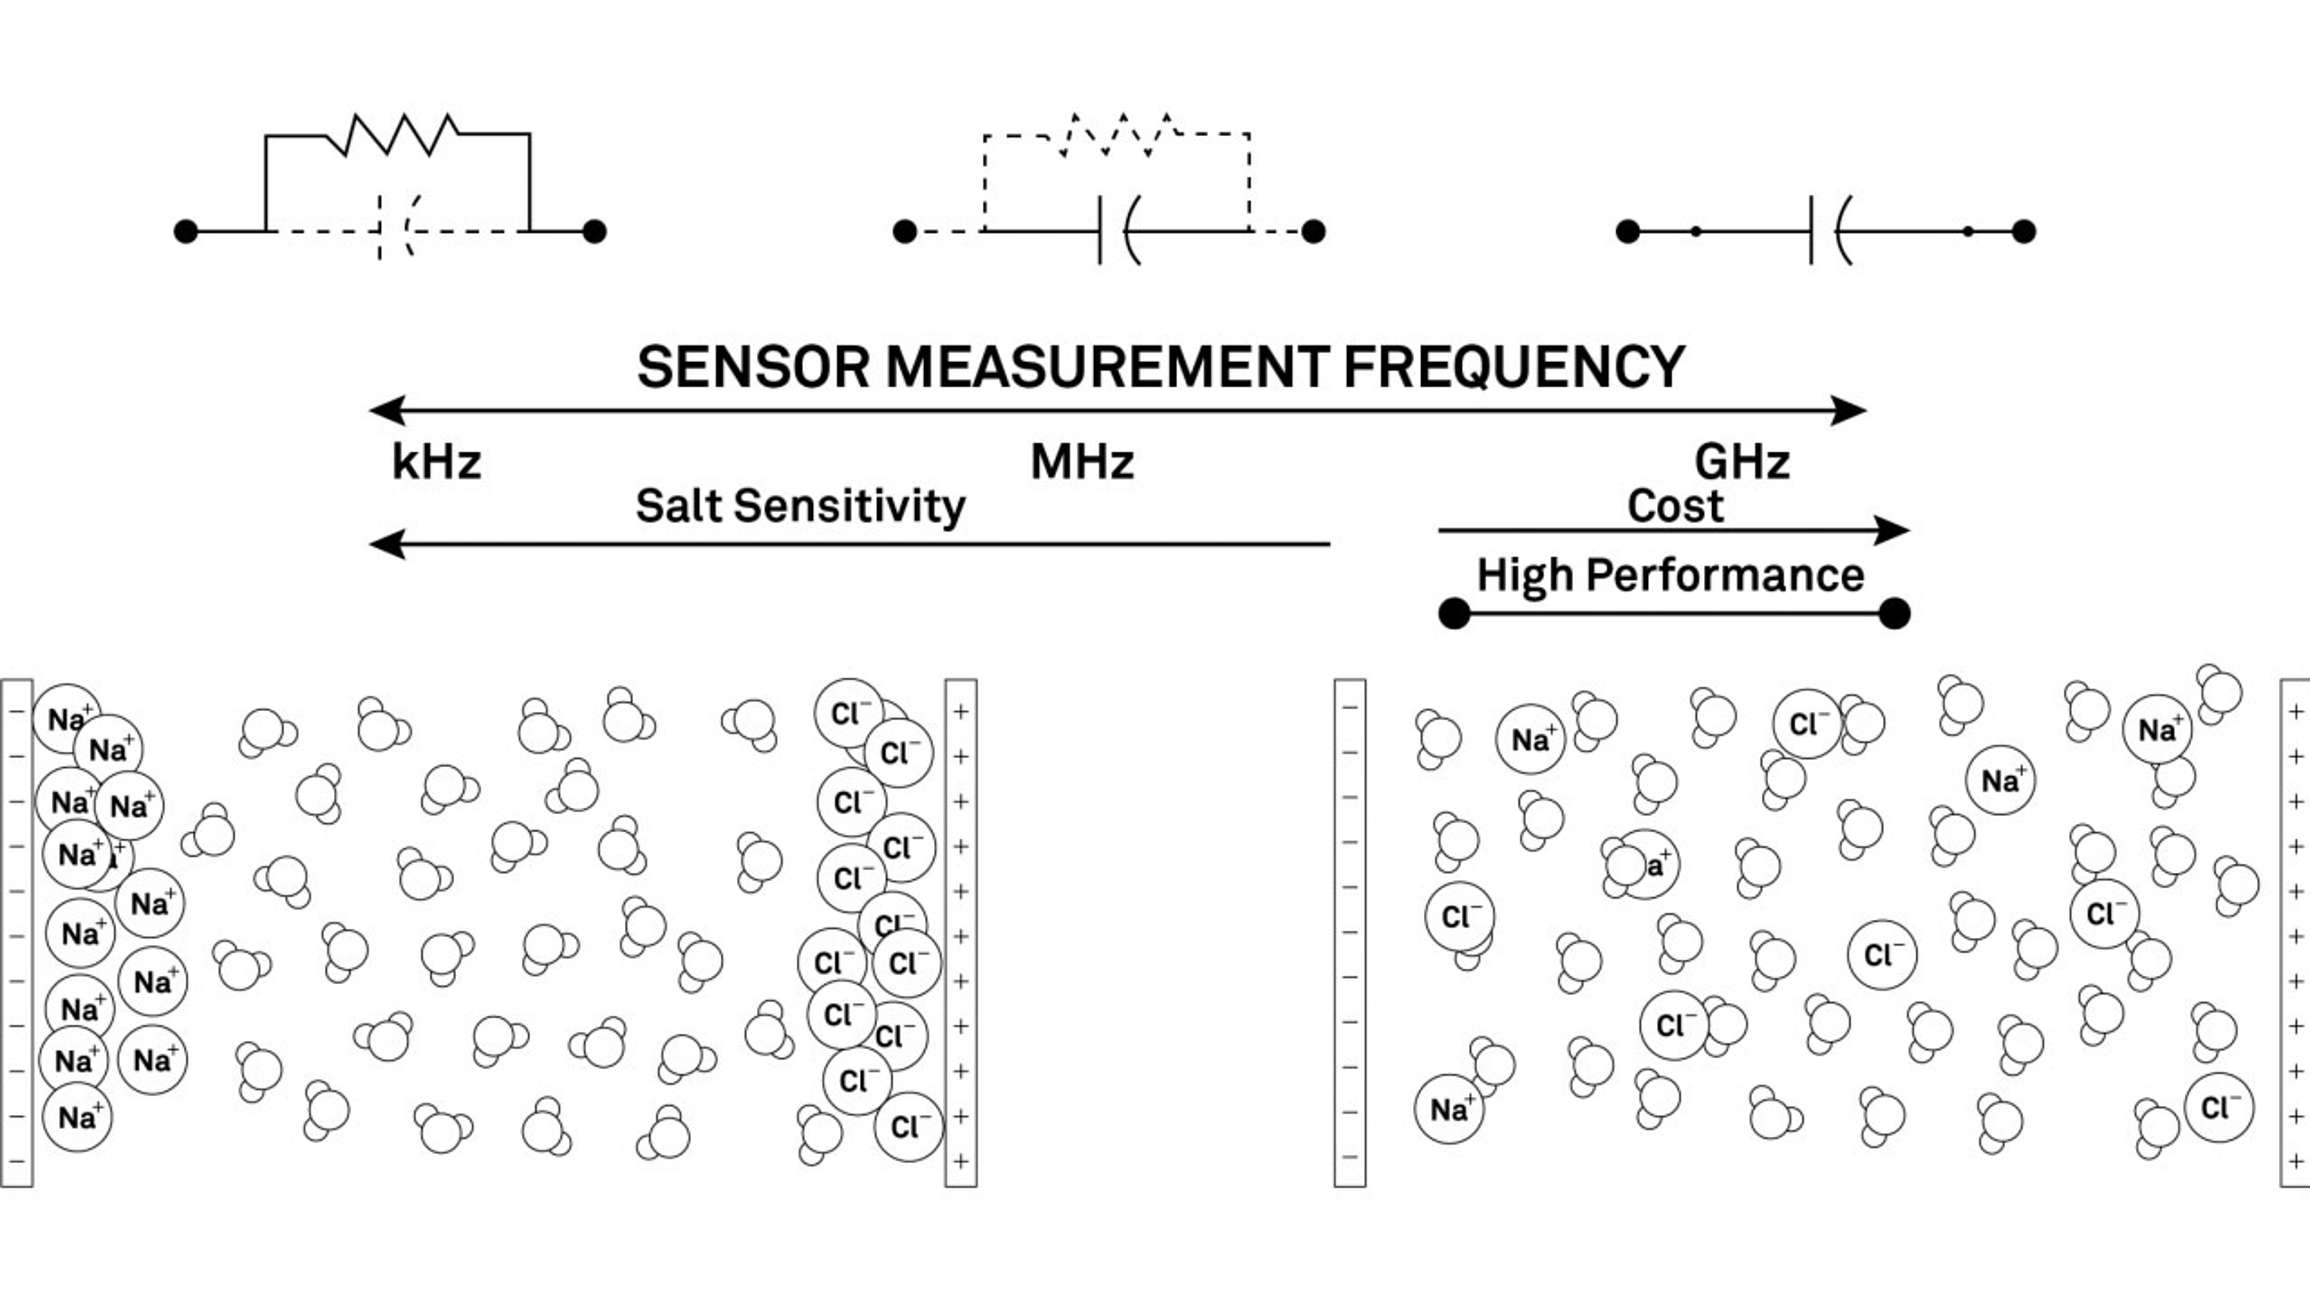
Figure 12. Sensors that use higher measurement frequencies often cost more but can yield higher accuracy by avoiding the influence of dissolved ions or charged clay particles
At lower frequencies, dielectric sensors polarize the water and the salts making them incredibly sensitive to salinity in the soil. However, as measurement frequency increases (around 50 Mhz and above) this influence is reduced. So if a sensor works in the kHz range (like a $5 dielectric sensor on Amazon) it doesn’t mean that sensor can avoid the many factors that extinguish sensor accuracy. And, even if a sensor works at a high measurement frequency, it still doesn’t guarantee success. Proper electrical system design also plays an important role.
There are several types of dielectric sensors available, and the webinar at the beginning of this article (above) gives more information on each of these technologies. The most common research-grade water content sensors on the market fall into three general categories.
Capacitance- a capacitance sensor uses the soil as a capacitor element and use the soil charge storing capacity to calibrate to water content.
Time-domain reflectometry (TDR) a TDR sensor measures the travel time of a reflected wave of electrical energy along a transmission line. The travel time is related to the charge storing capacity of the soil and the volumetric water content. Interestingly, TDR contains a range of frequencies (not just a single frequency) in the signal, which can help reduce errors from soil salinity.
Frequency-domain sensors (FDR) also use the soil as a capacitor to measure the maximum resonant frequency in the electrical circuit and relate the resonant frequency to water content.
All of these categories contain some sensors that perform well and some sensors that do not. Many studies have shown that the following sensors measure content well: METER’s (formerly Decagon Devices) EC-5, 10HS, 5TE/TM (now TEROS 10/11/12), as well as Campbell Scientific’s CS655, TDR 200 and SoilVue 10, Delta T’s Theta Probe and SM series, Stevens’ Hydra Probe, and Acclima’s TrueTDR series. All of these sensors may require user calibration depending on soil type and electrical conductivity.
Vaz et al (2013) provides a careful study that compares several of these sensors (read it here) and would be useful for a more in-depth review. These types of studies are a great starting point, but there are even more factors to consider when choosing a soil moisture sensor for your unique application. We explore these factors in the sections below.
The following two charts compare the most common soil moisture sensing methods (TDR sensors, FDR sensors, capacitance sensors, resistance sensors, COSMOS, neutron probe), the pros and cons of each, and in what type of situation each method might be useful. All METER soil moisture sensors use a high-frequency capacitance sensing technique and an installation tool for easy installation and to ensure the highest possible accuracy. For more in-depth information about each measurement method, watch Soil moisture 201: measurements, methods, and applications.
Types of soil moisture sensors
*Acclima and Campbell Scientific make TDR sensors/profile probes that have on board measurement circuitry, which overcomes the challenge of complexity most TDR systems face.
**This depends on measurement frequency, the higher the frequency, the lower the sensitivity.
Sensor
Pros
Cons
When to Use
Resistance
Probes
1. Continuous measurements can be collected with data logger
2. Lowest price
3. Low power use
1. Poor accuracy: calibration changes with soil type and soil salt content
2. Sensors degrade over time
1. When you only want to know if water content changed and don’t care about accuracy
TDR Probes
(Time Domain)
1. Continuous measurements can be collected with data logger
2. Accurate with soil-specific calibration (2-3%)
3. Insensitive to salinity until the signal disappears
4. Respected by reviewers
1. More complicated to use than capacitance*
2. Takes time to install because you must dig a trench rather than a hole
3. Stops working in high salinity
4. Uses a lot of power (large rechargeable batteries)
1. If your lab already owns the system. They are more expensive and complex than capacitance, and studies show both TDR and capacitance to be equally accurate with calibration
Capacitance Sensors
1. Continuous measurements can be collected with data logger
2. Some types are easy to install
3. Accurate with soil-specific calibration (2-3%)
4. Uses little power (small batteries with little or no solar panel)
5. Inexpensive, you can obtain many more measurements for the money you spend
1. Becomes inaccurate in high salinity (above 8 dS/m saturation extract)**
2. Some low quality brands produce poor accuracy, performance.
1. You need a lot of measurement locations
2. You need a system that’s simple to deploy and maintain
3. You need low power
4. You need more measurements per dollar spent
Neutron Probe
1. Large measurement volume
2. Insensitive to salinity
3. Respected by reviewers, since method has been around the longest
4. Not affected by soil-sensor contact problems
1. Expensive
2. Need a radiation certificate to operate
3. Extremely time-intensive
4. No continuous measurement
1. You already have a neutron probe in your program with the certification, and you already know how to interpret neutron probe data
2. You are measuring highly saline or swell-shrink clay soils where maintaining contact is a problem
COSMOS
1. Extremely large volume of influence (800 m)
2. Automated
3. Effective for ground truthing satellite data as it smooths variability over a large area
4. Not affected by soil-sensor contact problems
1. Most expensive
2. Measurement volume poorly defined and changes with soil water content
3. Accuracy may be limited by confounding factors such as vegetation
1. When you need to get a water content average over a wide area
2. You are ground truthing satellite data
A comparison of sensor benefits
*Some low quality brands exhibit low accuracy and poor performance. The largest threats to accuracy for both TDR and capacitance sensors are air gaps caused by poor installation, followed by clay activity in the soil (i.e. the smectite clays), followed by salinity.
Resistance
TDR
Capacitance
Neutron Probe
COSMOS
Price
Lowest
Moderate to high
Low to moderate
High
Highest
Accuracy
Low
High*
(with soil-specific calibration)
High*
(with soil-specific calibration)
Low (Improves with field calibration)
Unknown
Complexity
Easy
Easy to intermediate
Easy
Difficult
Difficult
Power use
Low
Moderate to high
Low
N/A
High
Salinity Sensitivity
Extreme
1. None in low to medium salinity
2. Yes in high salinity
Yes in high salinity
No
No
Durability
Low
High
High
High
High
Volume of Influence
Small area between probe A and probe B
0.25 liter to 2 liters depending on probe length and shape of the electro-
magnetic field
0.25 liter to 2 liters depending on probe length and shape of the electro-
magnetic field
20 cm diameter sphere when soil is wet, 40 cm diameter sphere when soil is dry
800 meter diameter
Accuracy is about more than just the sensor
At the Rush Valley research site mentioned earlier, there were four treatments repeated five times with sensors at multiple depths in each treatment. The goal of the study was to see how rodents and prescribed burns affect native and invasive species diversity with changing precipitation. Two of the most challenging aspects of the project were choosing a sensor that would ensure effective installation and how to accumulate data and provide it efficiently to the many project stakeholders.
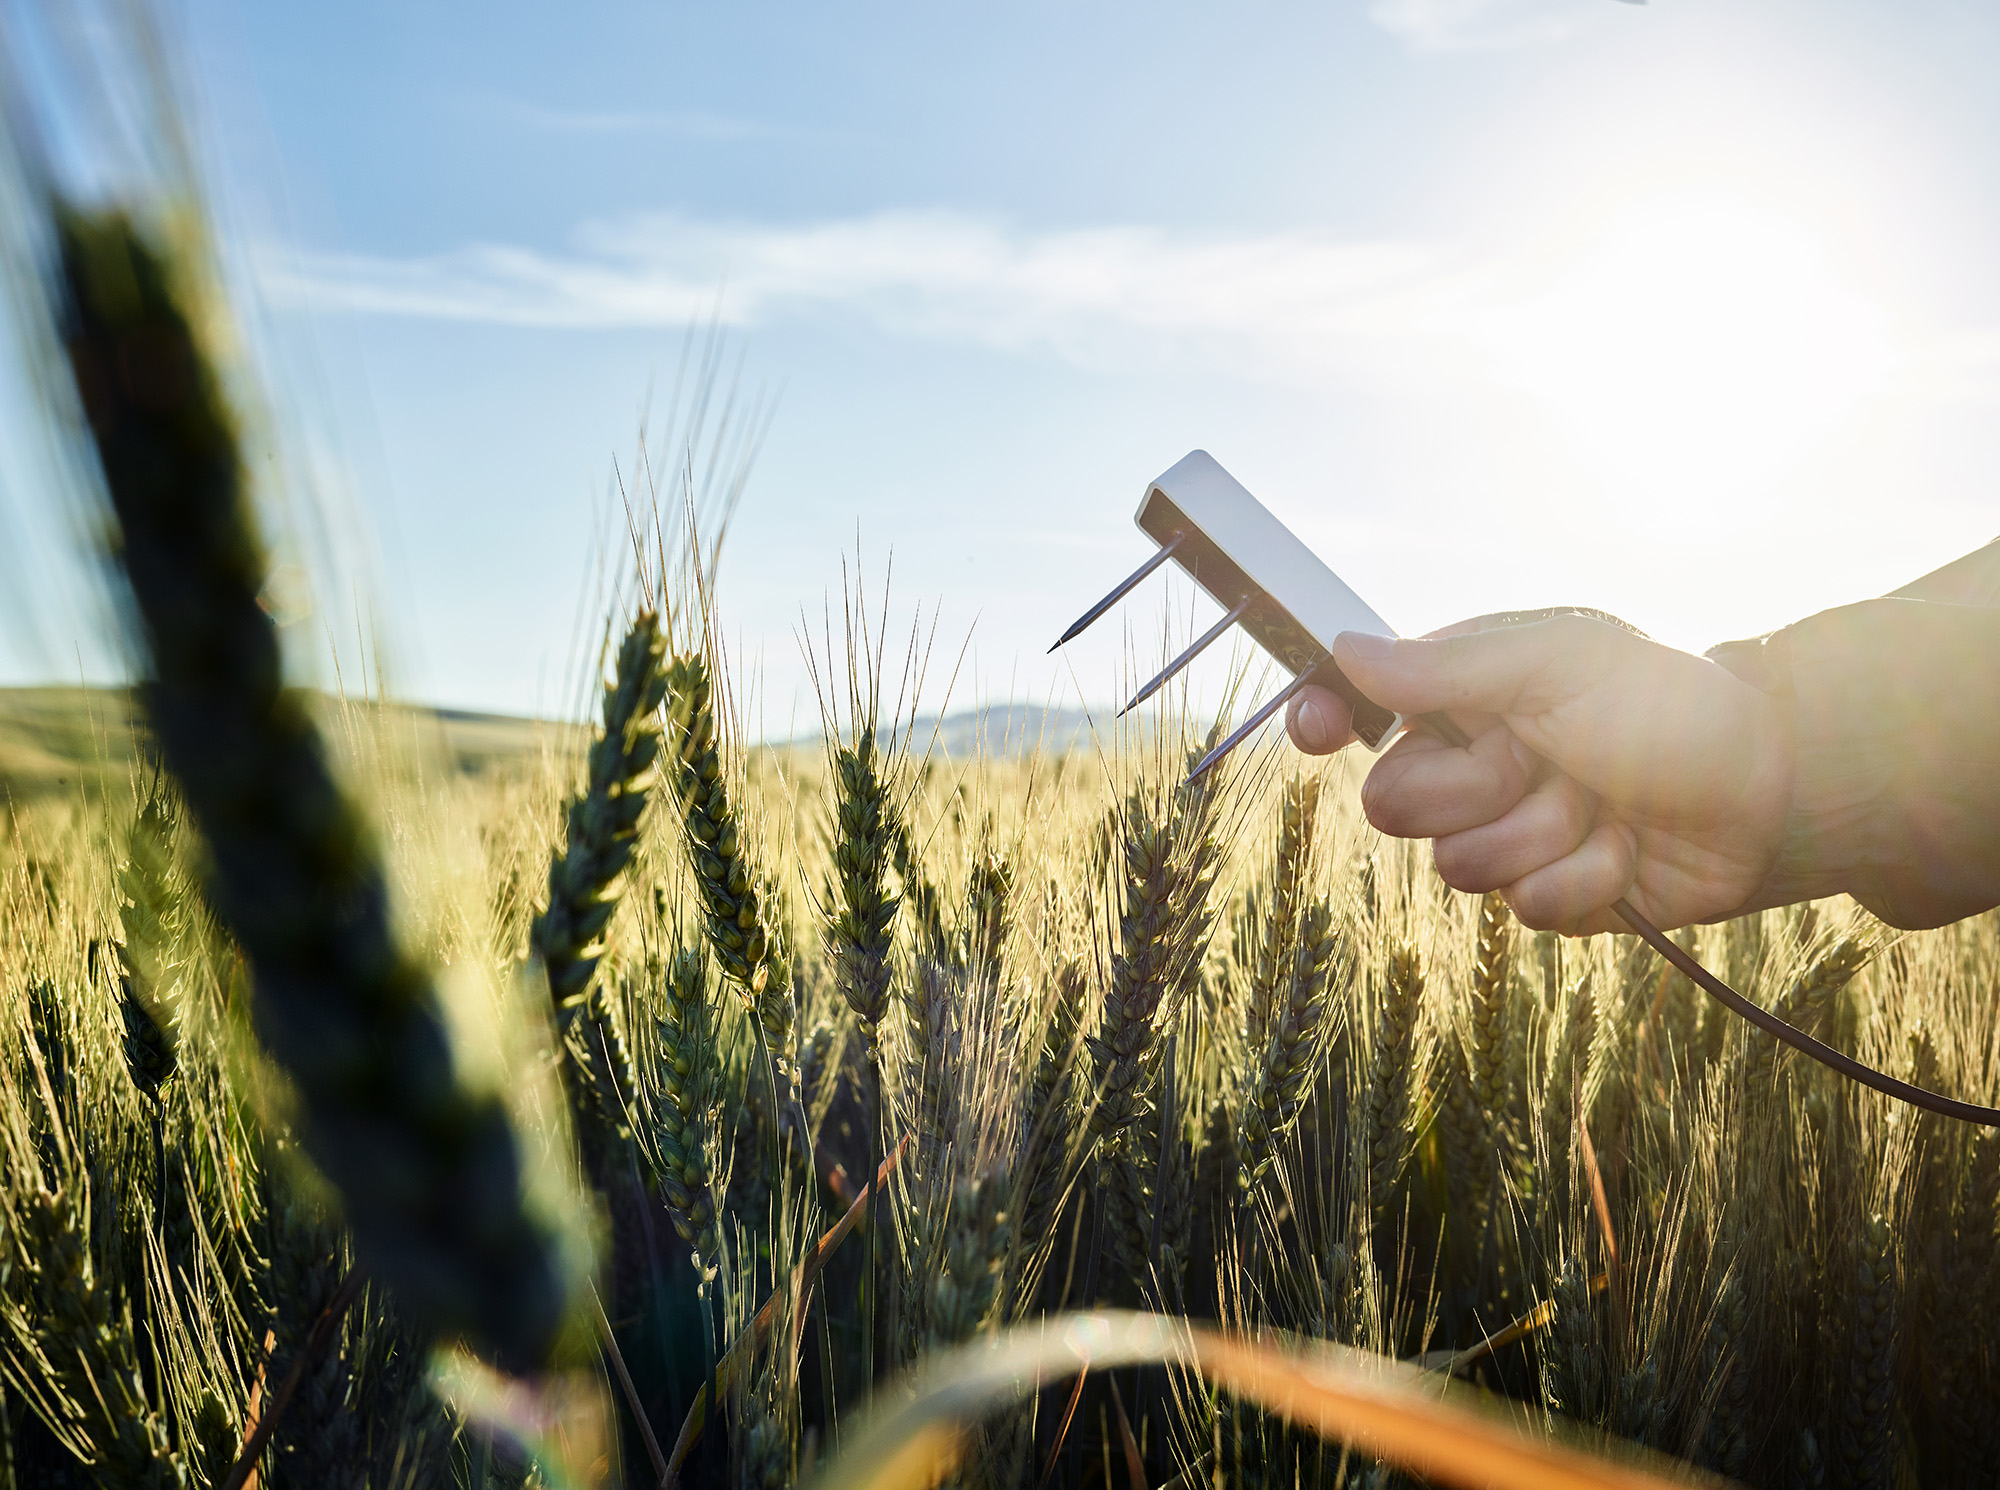
In 2019, METER released a full-featured soil moisture sensing system that focused on simple deployment and eliminated the three most common barriers to good accuracy: installation inconsistency, sensor-to-sensor variability, and sensor verification. Below is a video showing the TEROS 12 soil moisture sensor (a high-frequency dielectric sensor that uses capacitance technology) being installed with the new borehole installation tool.
Using this method, sensors are quickly installed at several depths down two meters in the soil. The tool inserts the sensor exactly perpendicular to the soil. The mechanical advantage of the lever in conjunction with sharpened, high-quality sensor needles ensure near-perfect installation every time, even in hard soils.
IoT systems improve modern sensing
In addition to installation, reliable data collection and visualization are essential considerations. The introduction of IoT technology (ZENTRA Cloud) now provides opportunities to make modern sensing more efficient and effective.
For example, METER’s ZENTRA system is a complete IoT system of sensors, loggers, and software that are easily deployed, require little maintenance, and put near-real-time data at your fingertips so you can publish more, and work less. The video below shows someone checking for problems remotely in ZENTRA Cloud software.
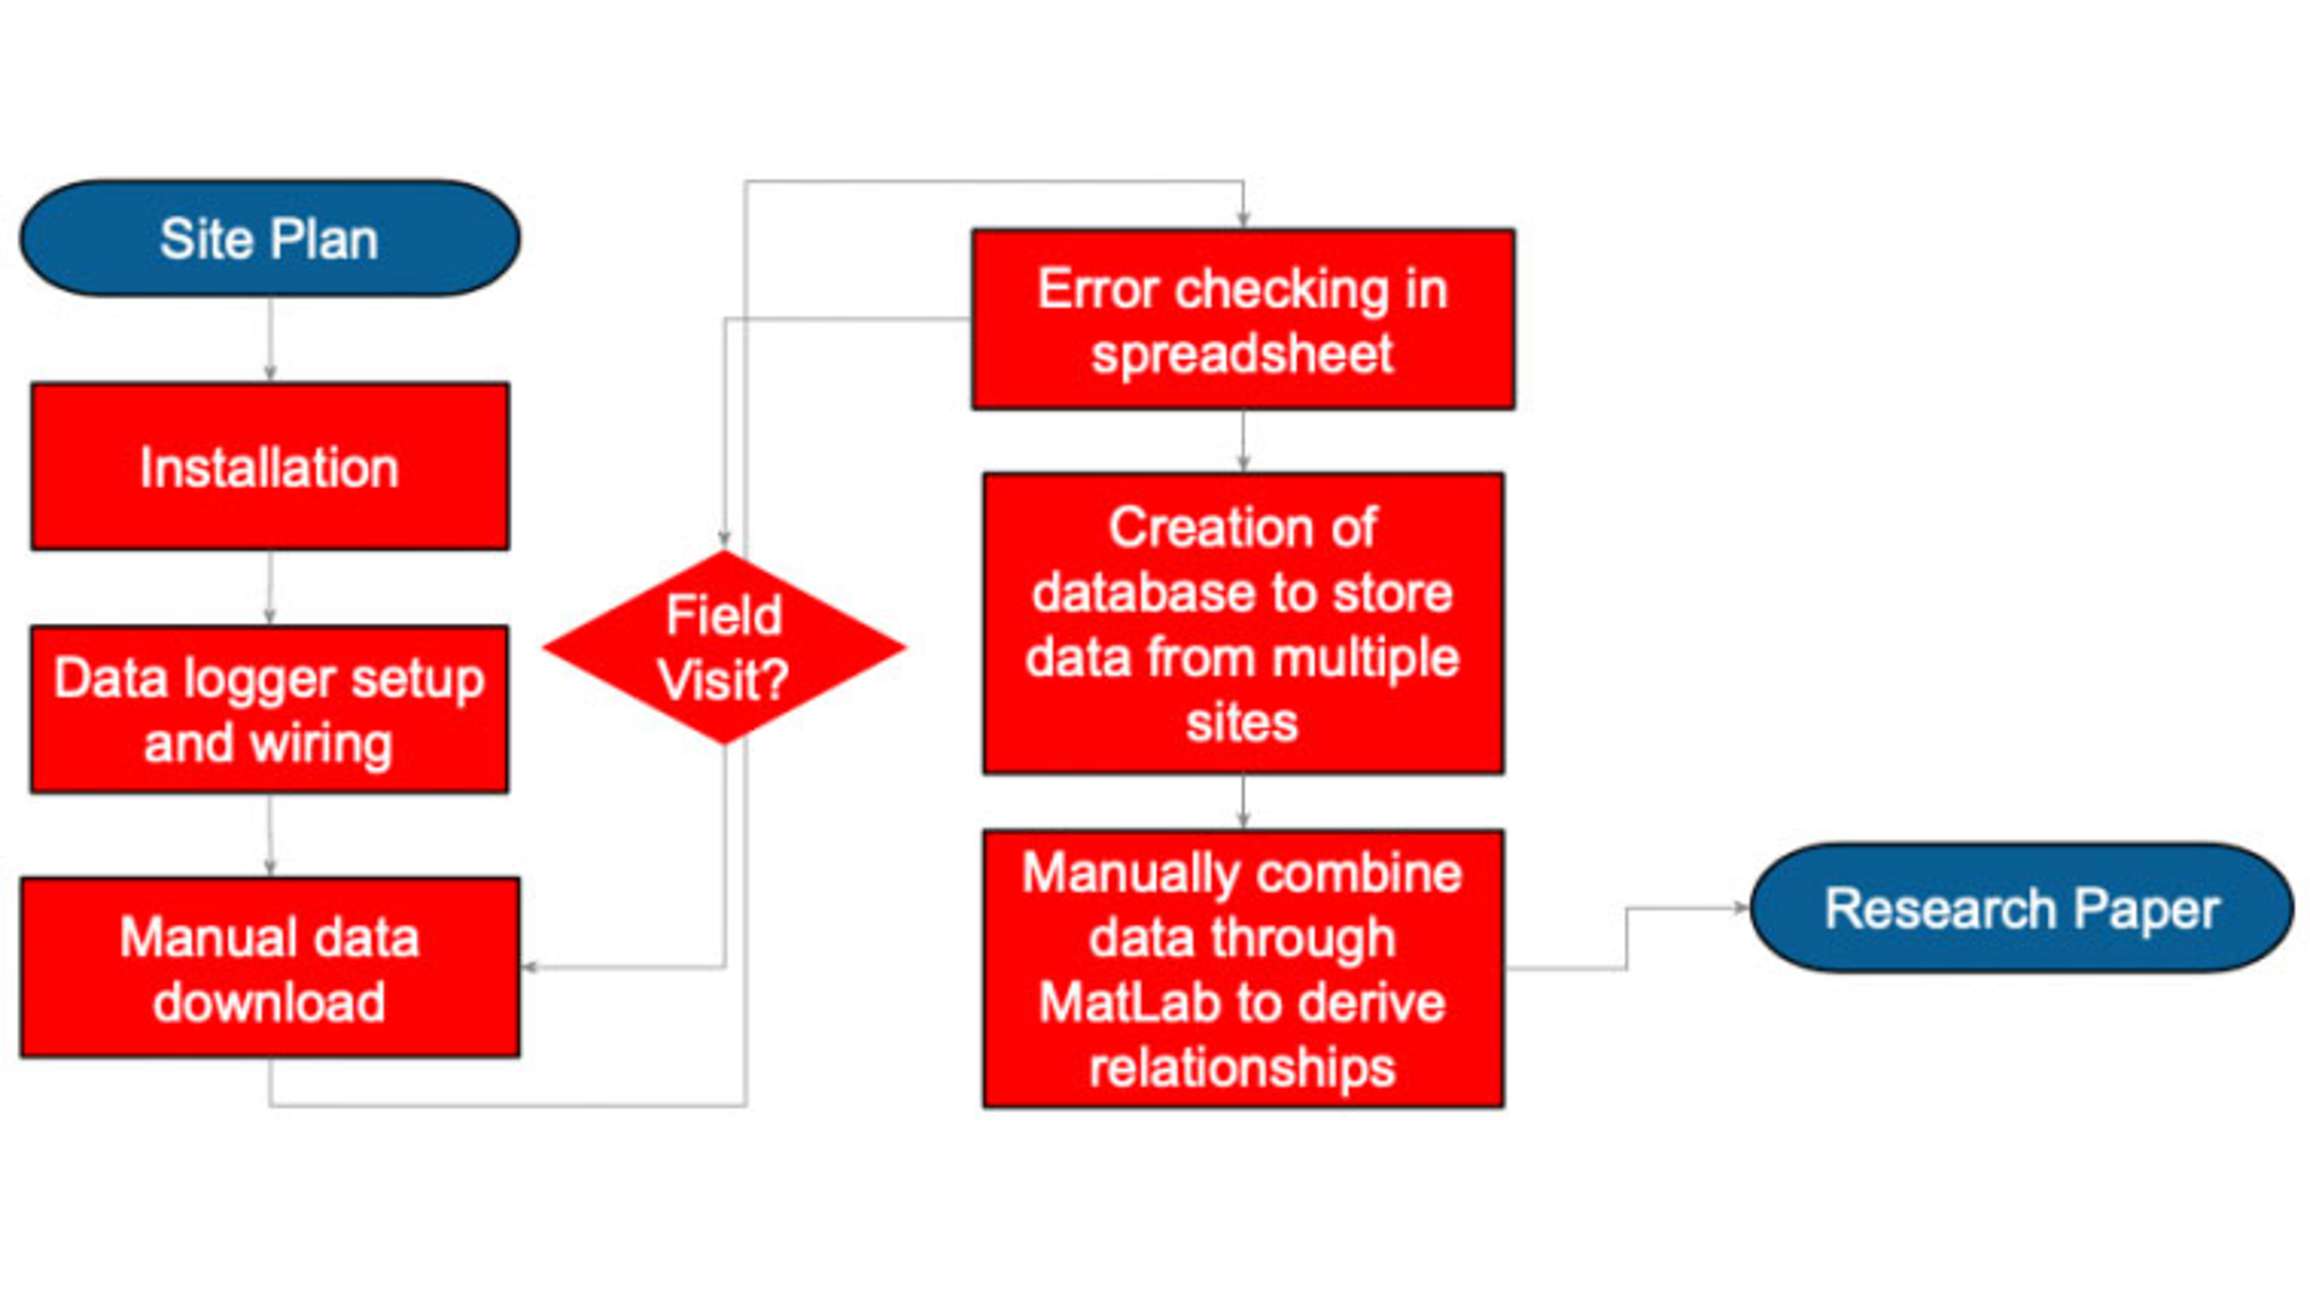
Below is a typical researcher workflow. Red indicates unnecessary work either eliminated or simplified by the ZENTRA system.
Figure 14. Typical researcher workflow
ZENTRA reduces unnecessary cost and labor, so you can spend more time on your research. Click the links in the table below to explore how each part of the system works together to simplify the research process.
While there are a staggering number of water content sensors out there (TDR sensors, FDR sensors, capacitance sensors, resistance sensors), choosing one specifically for your measurement needs may be more simple than it appears. Relying on a resistance-based technique will not yield good results despite the attractive price and simple integration into a measurement project. Changing salinity in the soil driven by salinity, fertilizer, and even soil type will often result in perplexing sensor readings and frustration on your part. Dielectric-based sensors (TDR, FDR, capacitance) are a far better choice but still need careful consideration as not all dielectric sensors are created equally. Although there are a few different approaches to measuring the dielectric or charge-storing capacity of the soil, studies show that performance is more closely related to a good installation and individual sensor qualities like measurement frequency and circuit design rather than a specific measurement technology, such as capacitance, FDR, or TDR. In general, higher frequency measurements result in higher quality data, but also higher sensor cost. One might say that true value in a sensor comes from the optimization of the balance between performance and price.
Resources
Evaluation of Standard Calibration Functions for Eight Electromagnetic Soil Moisture Sensors (article link)
A Complex Dielectric Sensor for Measurement of Water Content and Salinity in Porous Media (article link)
Meet our newest soil moisture sensors
We created the new TEROS sensor line to eliminate barriers to good accuracy such as installation inconsistency, sensor-to-sensor variability, and sensor verification. TEROS soil moisture sensors combine consistent, flawless installation with an installation tool, extremely robust construction, minimal sensor-to-sensor variability, a large volume of influence, and advanced datalogging to deliver the best performance, accuracy, ease-of-use, and reliability at a price you can afford.
Want more details? In the video below, soil moisture expert Leo Rivera explains why we’ve spent 20 years creating the new TEROS sensor line.
Get the complete picture
Everything you need to know about measuring soil moisture—all in one place.
Six short videos teach you everything you need to know about soil water content and soil water potential—and why you should measure them together. Plus, master the basics of soil hydraulic conductivity.
Among the thousands of peer-reviewed publications using METER soil sensors, no type emerges as the favorite. Thus sensor choice should be based on your needs and application. Use these considerations to help identify the perfect sensor for your research.
Most people look at soil moisture only in terms of one variable—water content. But two types of variables are required to describe the state of water in the soil.