Growing degree day models: The complete guide to better accuracy
Six short videos—everything you need to know about how to nail your GDD predictions.

Not all weather data are created equal. Globally, regionally, nationally, citywide, or within a specific field – the scope and accuracy of weather data sources vary as much as the projects using them. Sources available include research weather stations, consumer-grade weather stations, virtual data, satellite data and more. It’s important for the validity of your data and the conservation of your time to understand the different options for growers and know how to choose the best data source for determining growing degree days, evapotranspiration, and more.
The type of data you need depends on how you plan on using it. Integrated pest management, crop models, irrigation, frost, pesticide drift, and labor management based on employees’ heat stress all have unique data requirements. Similarly, the type of crop you are working with can drastically change the data needed. In this article, we compare various types of weather data sources and what they can offer growers.
Global models
Global models integrate satellite data, a few ground measurements, and weather balloons to predict what is happening at all layers of the atmosphere. A lot of the weather services available to growers are based on global models. Often called “virtual weather stations”, these models are not based on one site or another, but rather a grid that has been established across the globe. The models assume the current time to be T-0 and provide forecasts for the future. Because they take a lot of resources to set up and operate, virtual weather stations are often run by governmental agencies. Weather services available on your phone are usually based on the combination of several global models with a statistical interpolation of the data retrieved from these models to provide a “local” forecast.
Weather station networks
Regional networks of weather stations, also known as mesonets, are often run statewide. They consist of a wide variety of instrumentation including METER’s ATMOS 41 and ATMOS 41W or Campbell Scientific’s MetPRO and MesoPRO. These weather stations are placed in open, level, unobstructed areas with grass cover to provide a neutral regional representation. Mesonets aim to establish a long-term record of high-quality measurements by implementing a standard configuration and providing regular maintenance to the instrumentation. While excellent at providing a statewide or regional understanding of atmospheric patterns, these networks are not intended to monitor microclimates.
Site-specific stations
For that reason, many growers choose to put weather stations in their orchards and fields to understand the specific microclimate their crops are experiencing and be able to manage resources and make decisions. In the past, site-specific stations were hard to maintain and required more time and expertise than many growers had. However, technological advancements have now made research-grade weather stations more cost-effective and user-friendly, making high-quality measurements accessible to most growers.
Site-specific weather stations can be installed in two locations. They can be placed outside the canopy to capture the microclimate in which the crop is growing. Or they can be installed within the canopy to capture both the microclimate and management effects including evaporation, cooling, and wind currents within the crop.
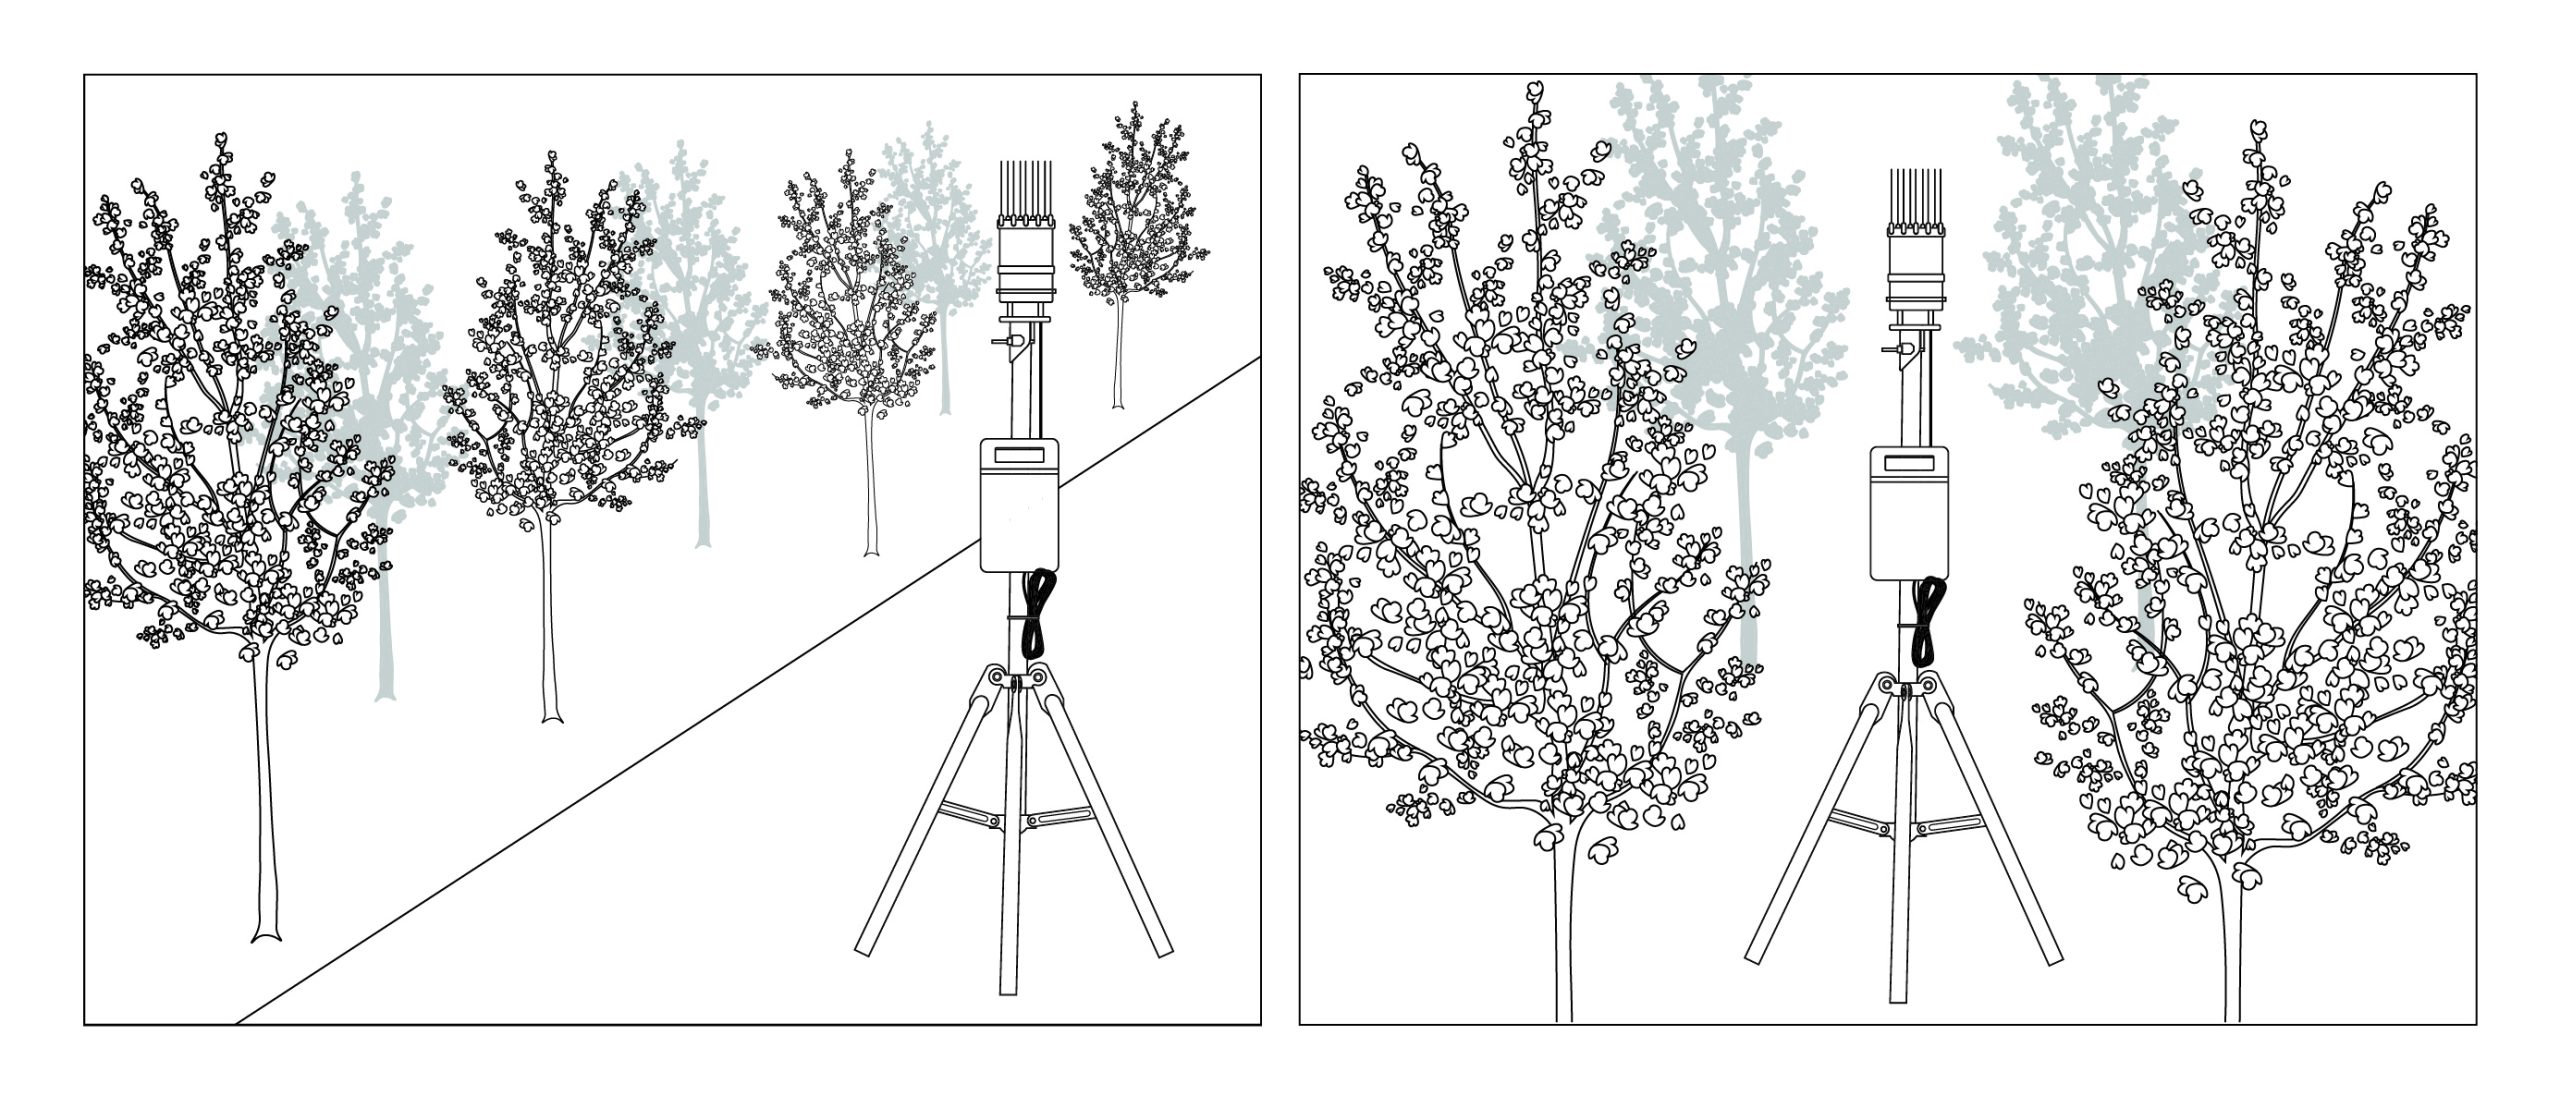
There is a large difference between measurements taken outside the canopy versus those taken within it, especially for crops such as fruit trees. In a study of apple trees funded by the Washington Tree Fruit Research Commission, researchers placed weather stations both inside and outside the canopy to compare the difference in readings. As Fig. X shows below, in season when leaves are present on the trees, it is much cooler within the canopy versus outside the canopy. This result makes sense due to evapotranspiration and irrigation causing evaporative cooling. Cold air was trapped in the orchard at night, so conditions became even cooler through the evening hours when there were stronger inversions.
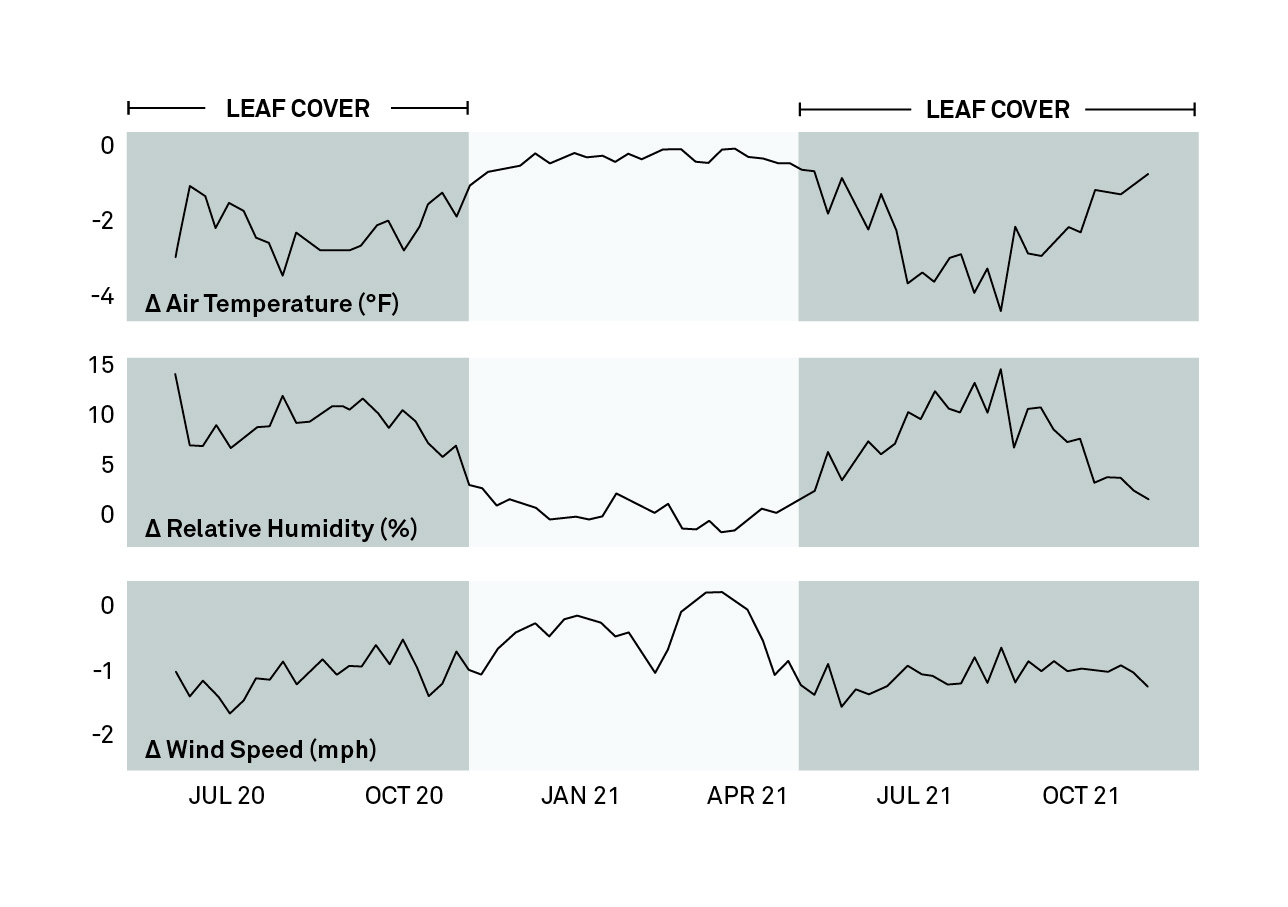
Figure 2 shows data from the summer of 2020 when the temperature shifted an average of 2°F. 2021 proved to be a hotter summer with a net effect of 4°F. The humidity measurements also reflect this large difference, showing it was wetter within the canopy than outside the canopy. Wind within the canopy was also drastically lower than the wind outside of the canopy with only one notable exception due to wind machines in use to protect from frost. These differences greatly affect your crop, bloom, pest, and disease models. If you can only measure outside the canopy, you need to consider these potential differences, but we highly recommend taking additional measurements from within the canopy, if at all possible.
That being said, METER does recommend putting your main weather station outside the canopy for drift regulations, which require wind measurements outside the canopy, and for calculating evapotranspiration to capture the total effect of that environment on that canopy. A weather station outside the canopy will also incur less wear and tear because it does not run the risk of interacting with the canopy. For management purposes, you need to be able to compare your measurements from inside the canopy to a baseline. Measurements outside the canopy provide a reference for those comparisons. Lastly, building up site-specific forecasting is possible, but to achieve that, you need measurements that are not contaminated by your management.
Comparing Growing Degree Days
The best way to understand the difference between the data sources is to simultaneously compare all the possible sources from one location and evaluate the results. The graph in Fig. 3 below shows that scenario for an orchard. At this site, we were able to compare growing degree days (GDD) calculated with data from five sources – a weather station within the canopy, a weather station outside the canopy, virtual weather from a weather app that has since been shut down called DarkSky, and two AgWeatherNetwork mesonet data locations to the south (Pasco) and northwest (Ringold) of the site.
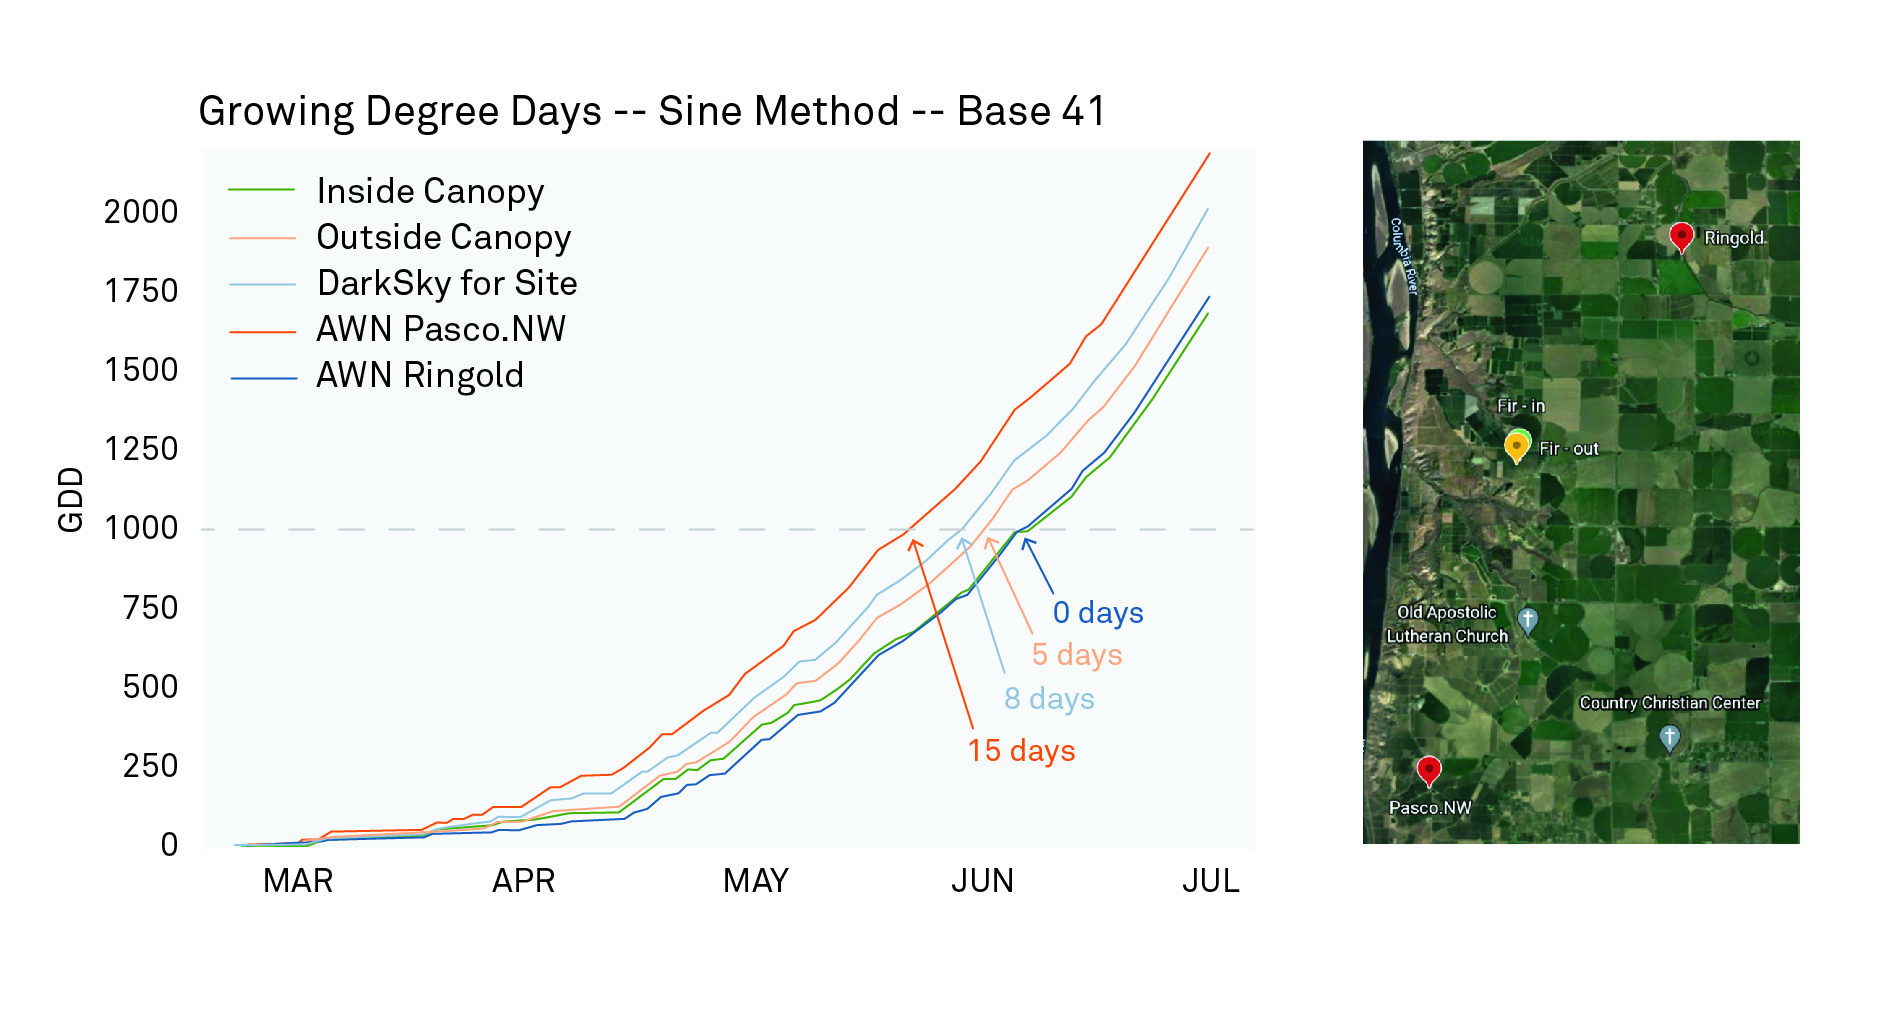
The optimal line in this analysis is the green line representing the weather station within the canopy. The AgWeatherNetwork (AWN) site at Ringold matches closely to the in-canopy measurements because that area is usually cooler than the Fir Road site generally experiences, but as mentioned before, conditions within the canopy are usually cooler than those of the area surrounding the crop. While this information coincidentally aligns, the Ringold location cannot be accurately assumed to be a reliable proxy for the in-canopy measurements. The GDD calculated with the AWN data from Pasco was 15 days off from the in-canopy measurements, the virtual weather data was eight days off, and the weather station outside the canopy was five days off. The weather station outside of a canopy can produce data either warmer or colder than the in-canopy data, but usually differs systematically, whereas the mesonet stations will have less accurate correlation, and virtual weather has no predictable correlation over time.
Virtual vs. real stations
In 2012-2020 AgWeatherNet initiated a study to compare DarkSky with the data they were measuring with their weather stations. DarkSky was chosen because at the time DarkSky was one of the best sources of virtual data sources. The daily high and low temperatures were gathered across 156 weather stations daily with duplicate air temperature sensors, resulting in just under half a million daily comparisons.
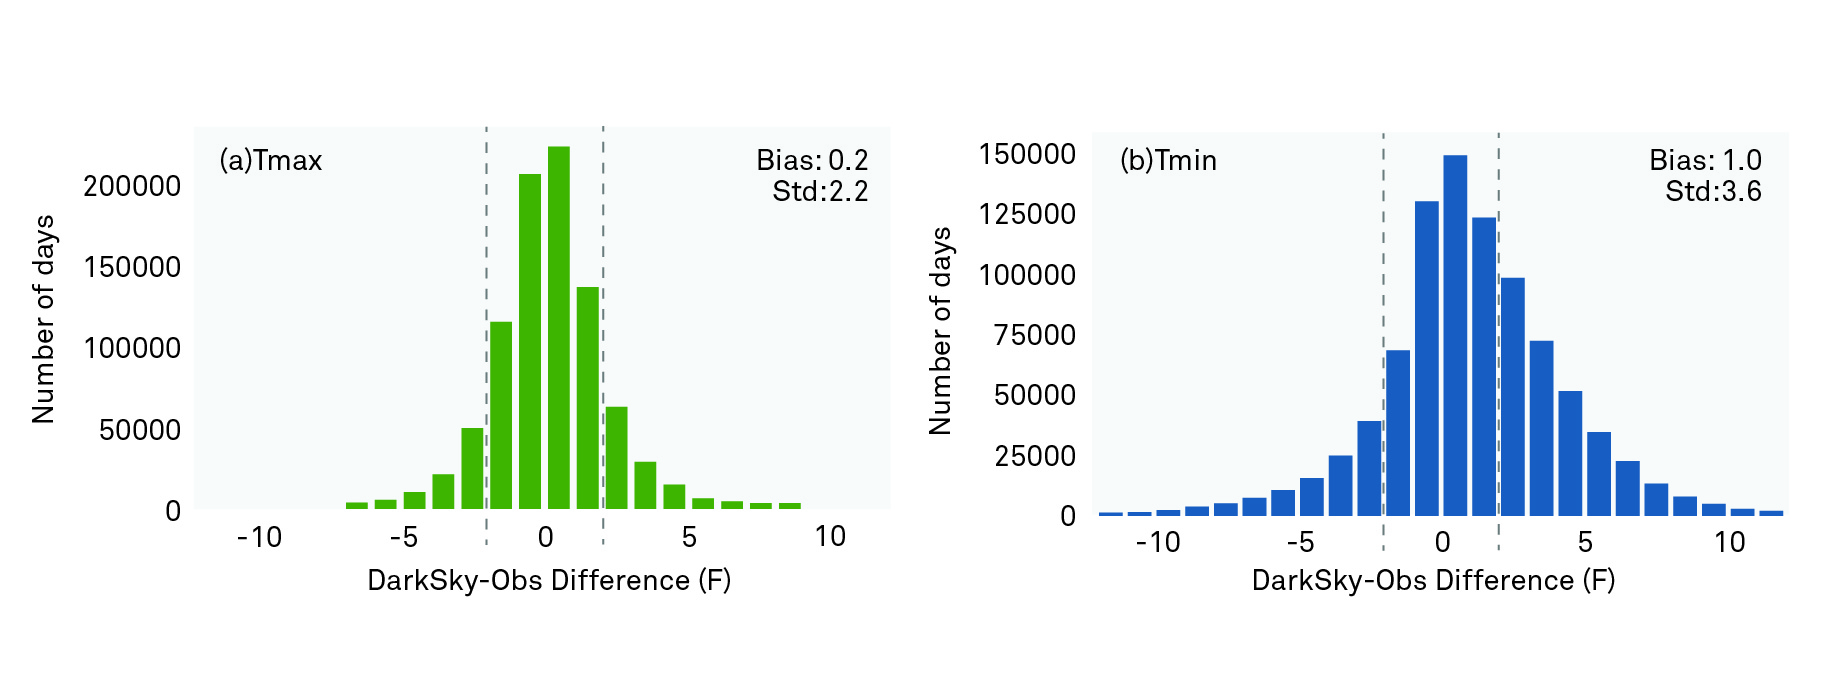
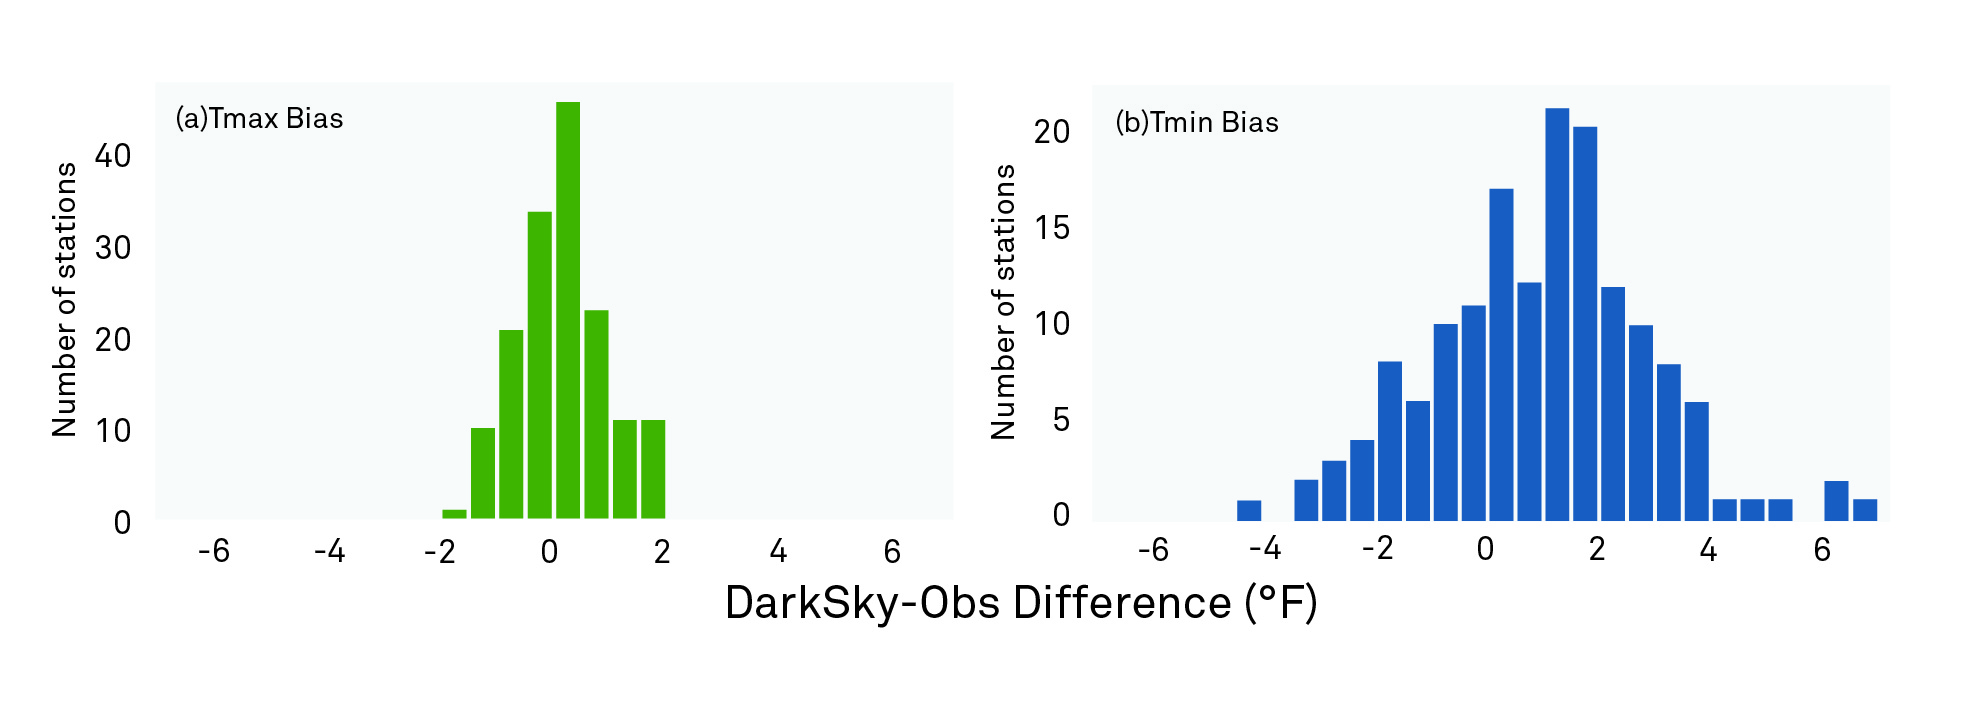
Fig. 4 shows the distribution of errors for virtual data’s minimum and maximum temperatures relative to the ground truth from the weather stations. The high temperatures are mostly within the standard deviation of 2°F (1.1°C), equivalent to a low-grade consumer weather station. For comparison, the ATMOS 41’s air temperature standard deviation is 0.45°F (0.25°C). Even with the majority of measurements falling within the standard deviation, there are still a significant number of readings beyond that threshold. The accuracy variation becomes even greater when measuring low temperatures.
Virtual weather models historically perform poorly at night because they make no attempt to capture cold air flows or your local topography. Since they are global models, they cannot include the details of your specific site. For these reasons, virtual weather models should never be used to make frost or other management decisions that rely on short-term data accumulations, such as a pollen tube growth model. Virtual weather is useful for parameters that rely on longer-term accumulations as the errors will average out, but any decisions that rely on short-term data will be highly skewed when using this data source.
The study also included a look at systematic site bias where data was compared across the whole 8 years of the study at sites that showed a bias. As shown in Fig. 5, the bias in virtual data compared to ground measurements was not consistent across locations enough to make reliable adjustments, especially when working with minimum temperatures.
When site bias stability is compared to the data at its own location, the study also showed that the bias at each station varied greatly year-over-year, as shown in Fig. 6.
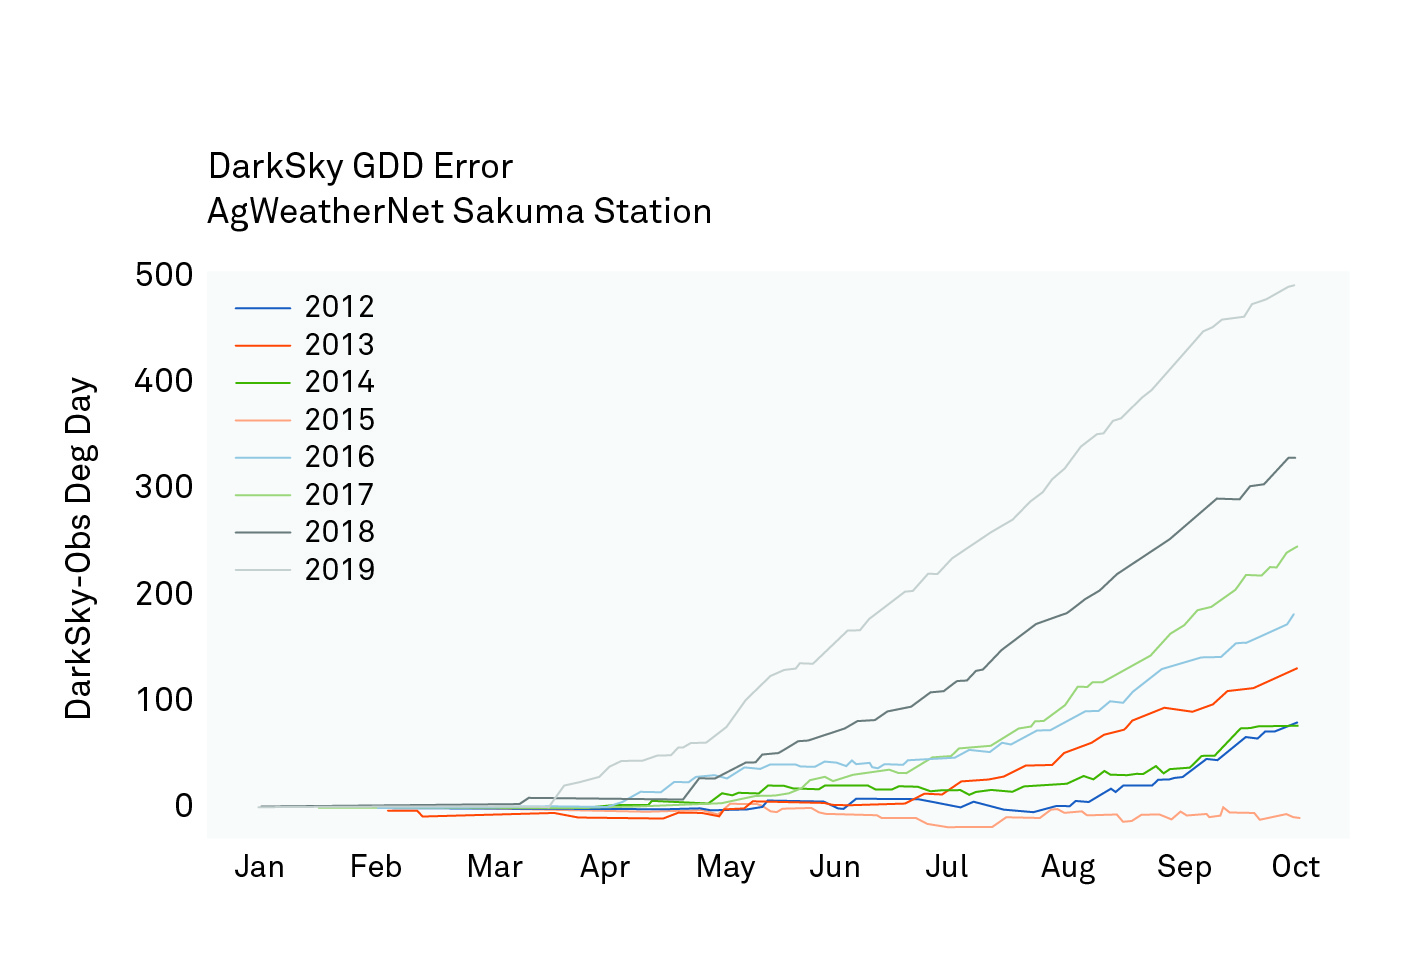
While the global models are updated over time, there is no guarantee the calculations for your specific site will improve. Their accuracy can never replicate the precision you get with measurements conducted at your site. If you were to use these measurements for any model or calculation such as GDD, your results could be radically incorrect with no way to calibrate them reliably.
Phenology models are an example of when incorrectly calculated GDD can have a huge negative impact. Pest species that cannot regulate their own temperature internally are reliant on ambient temperature for the energy to grow. Thus, growing degree days are used to predict when the organisms will reach certain milestones within their development and understand when a grower needs to be prepared to combat their effects.
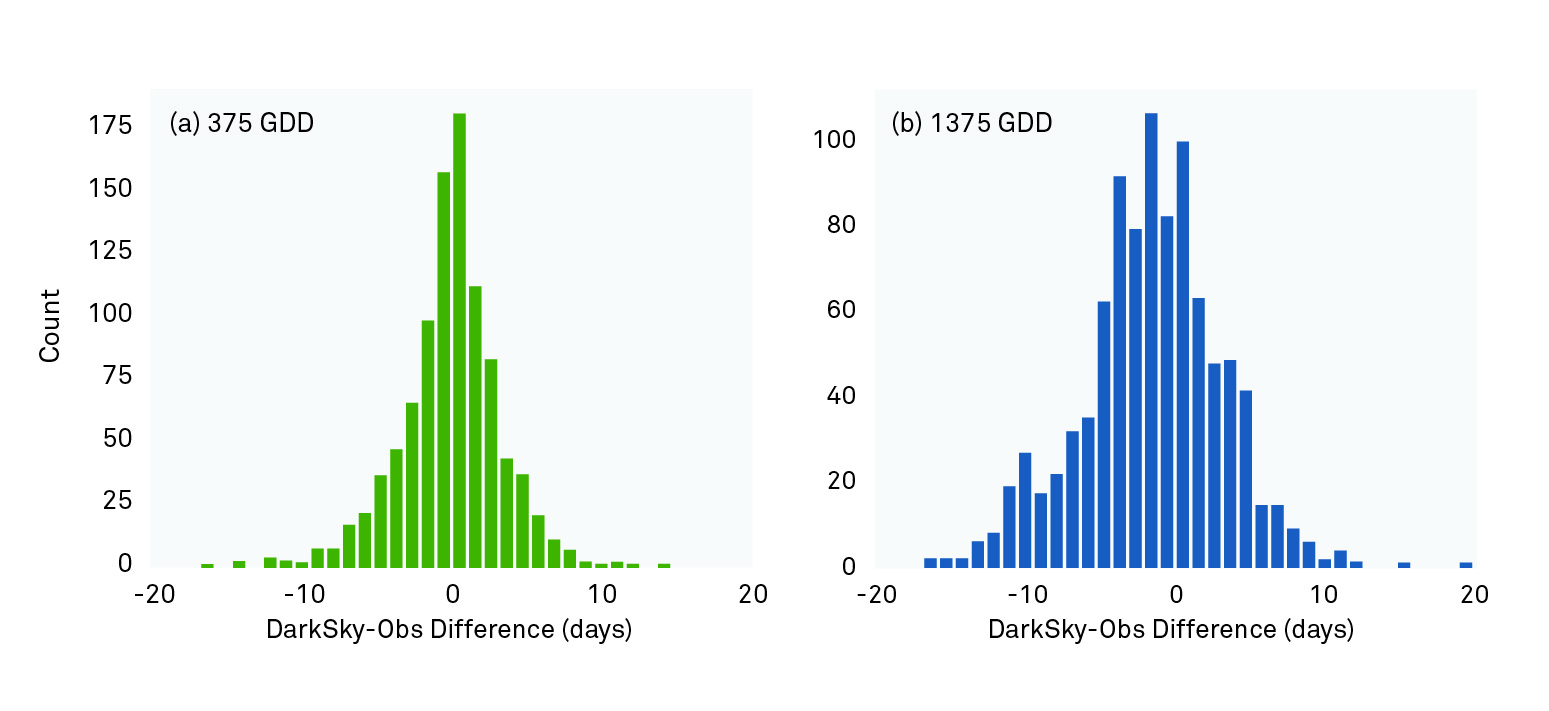
Fig. 7 above is a great example of weather errors magnifying over time. These graphs are showing codling moth models at 375 growing degree days, which is earlier in their season, and 1375 growing degree days, which is mid-season. This data is an aggregate of the virtual weather data from all station locations across the entire 8-year study, resulting in 1248 station-years represented within the data. At 375 GDD, 74% of all sites had what we considered to be a bad year, being off by 5 or more days at least once in the 8 years. With different sites being off each year, there is no predictability nor adjustments that can be made for these errors. By mid-season, the errors have gotten so large and widespread that the virtual weather is unusable for this modeling.
Weather stations in practice
Most growers know not to rely on virtual weather for their calculation needs. When using weather stations in a nearby mesonet, growers learn from experience how much they need to slide the scale for their precise location, understanding that their specific topography and microclimate is usually off by however many days in whichever direction. Virtual weather does not provide enough correlation to make reliable adjustments. Like the game of Marco Polo, you might have your eyes closed traveling in the direction of your friend shouting “Polo!”, getting closer and closer, when suddenly they swim underwater, and the sound is suddenly coming from a different direction.
Ultimately, global models have a lot of value when used in combination with weather stations and can be a very useful tool. Regional networks are useful for the long-term models that cannot be achieved with a grower’s own station, which has not been in place for as long. None of these three sources of weather should be discounted. Rather, it is important to understand their strengths and weaknesses to ensure you choose the right data source for each application.
Our scientists have decades of experience helping researchers and growers measure the soil-plant-atmosphere continuum.
Six short videos—everything you need to know about how to nail your GDD predictions.
Find out how different weather data sources compare and how those data affect the accuracy of common environmental models used by growers.
Accurate weather information is critical for understanding experimental results or modeling—and if you’re just guessing—you’ll be in trouble when it comes time for publication. You need data you can trust.
Receive the latest content on a regular basis.

