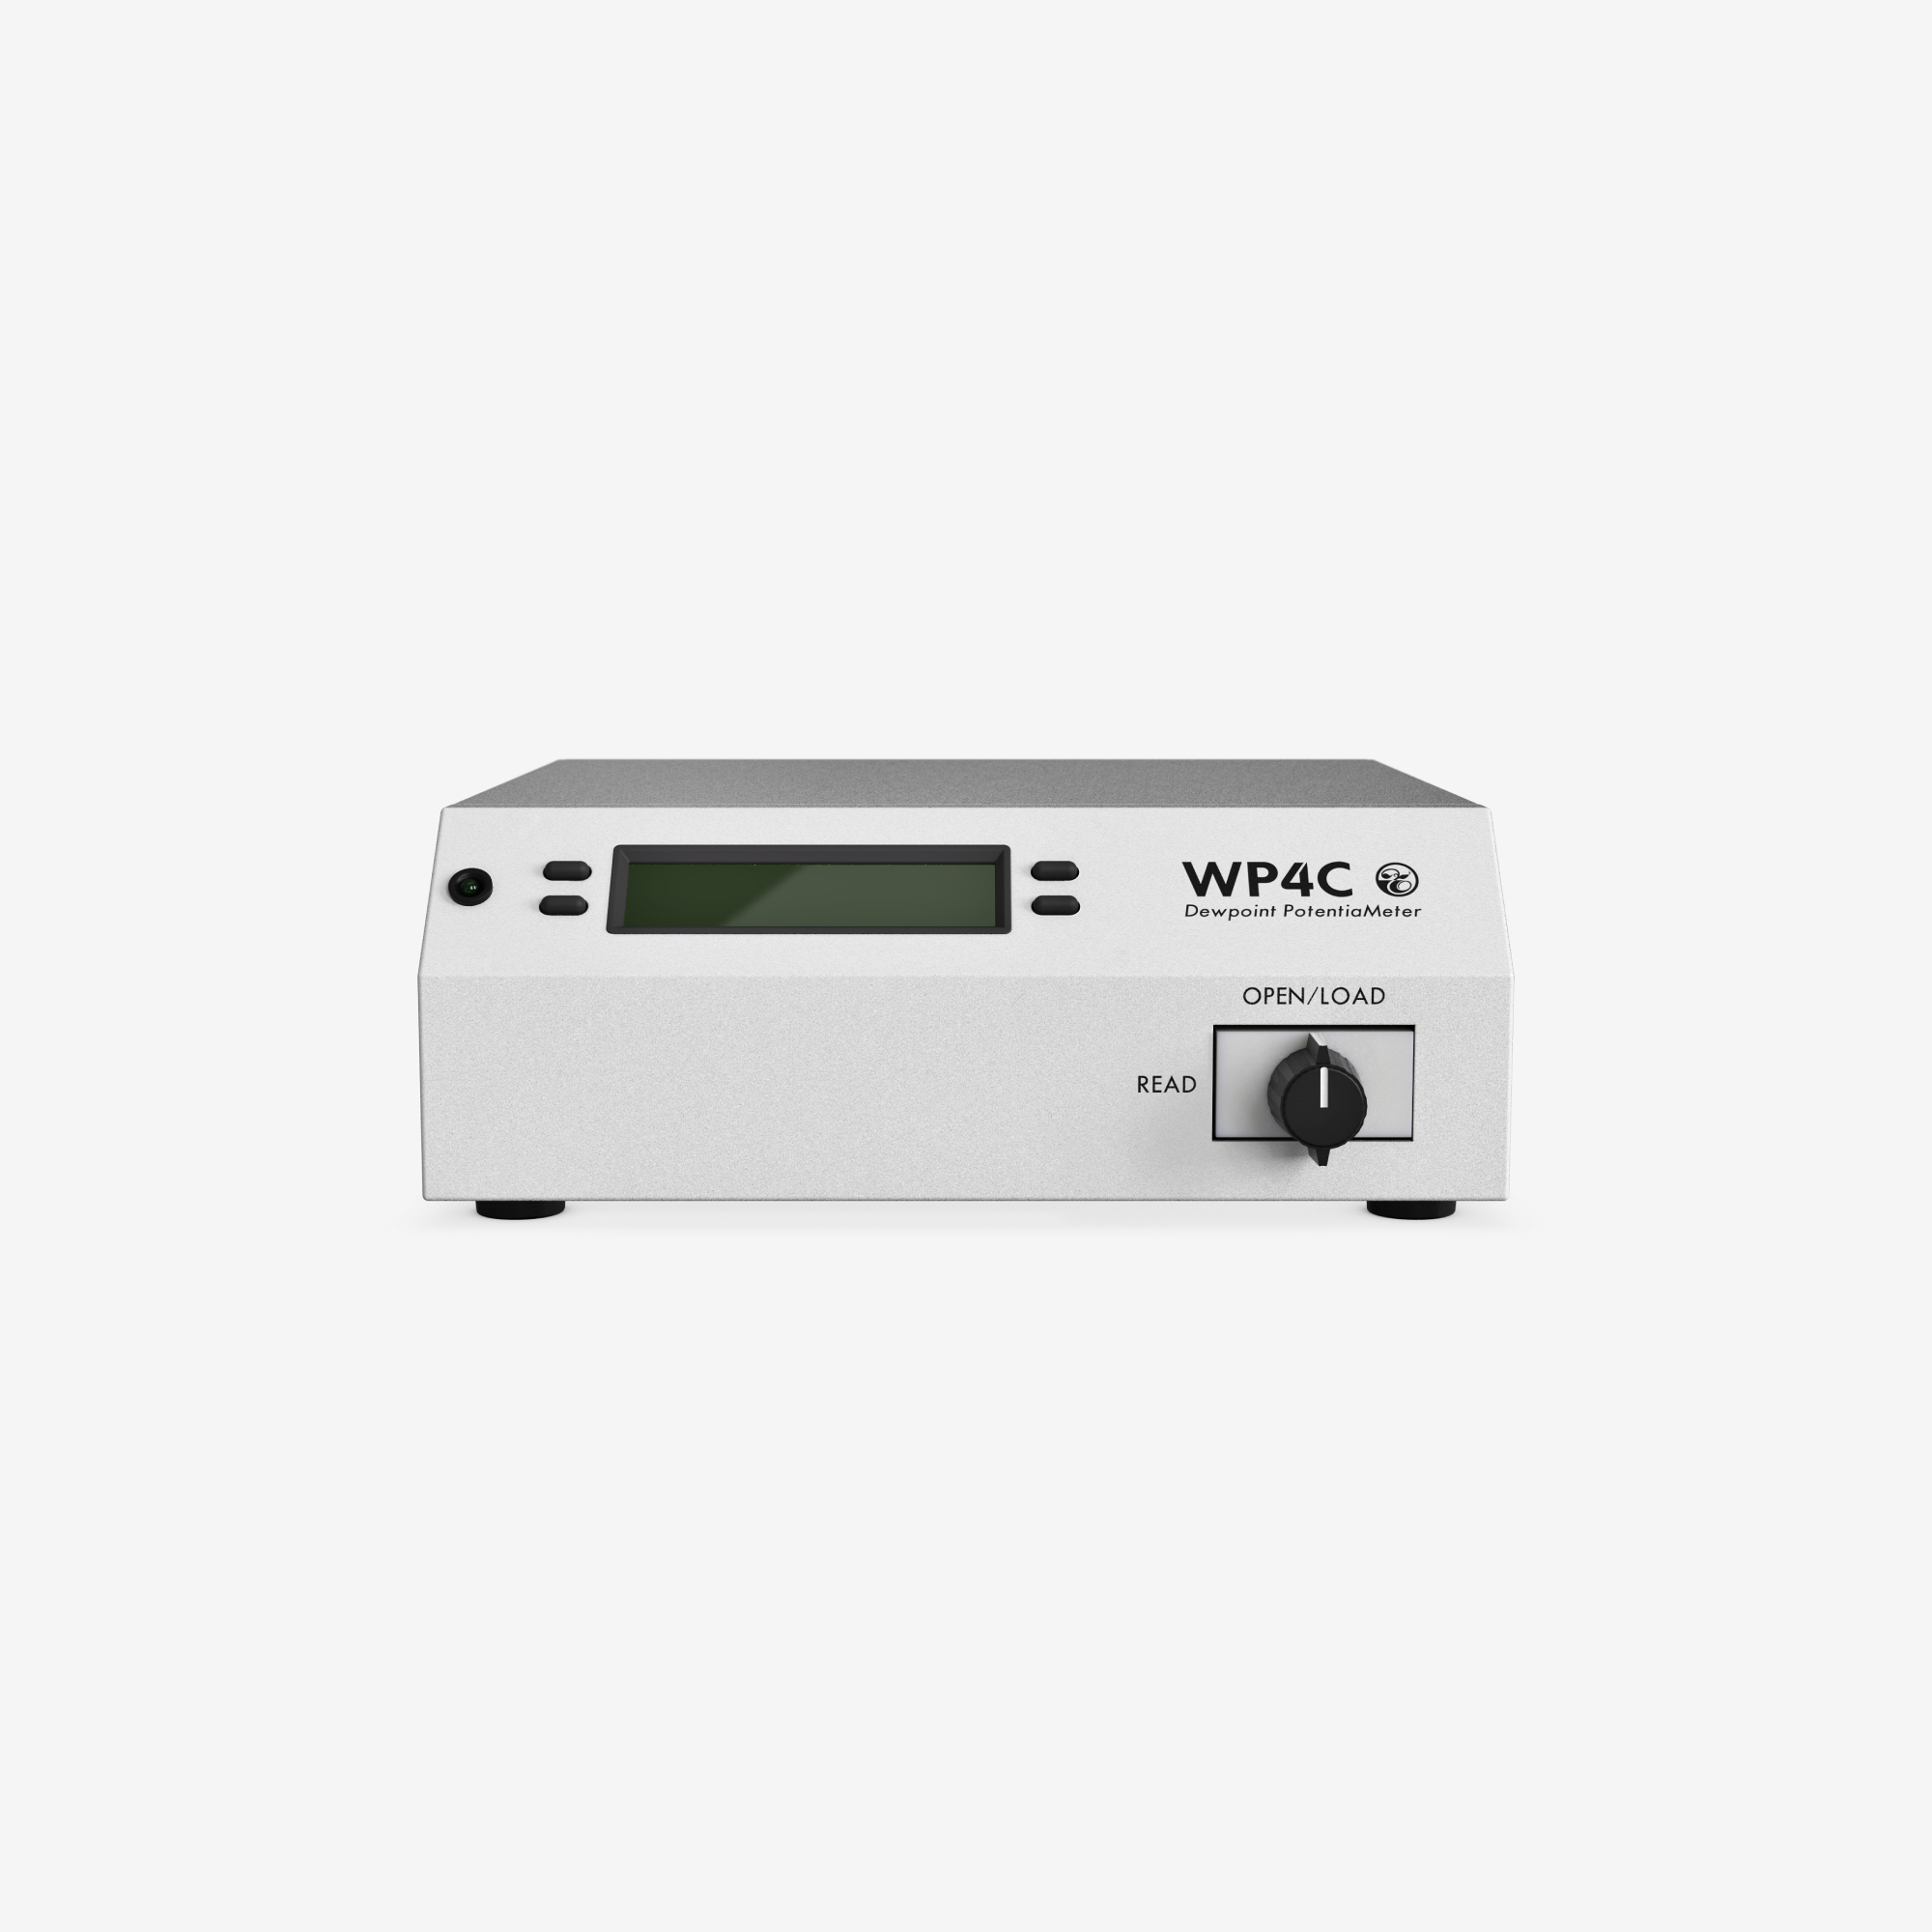
WP4C
Soil Water Potential Lab Instrument
base price for purchase, with rental options available
The WP4C measures water potential by determining the relative humidity of the air above a sample in a sealed chamber (conforms to ASTM D6836).
- Soil water potential lab instrument with fast equilibration
- Durable and easy to clean
- Easy to calibrate with saturated salt solutions

-
Overview / Features
-
The potential for error when measuring water potential
Measuring soil water potential is never easy. Traditional methods such as pressure plates or filter paper have always been problematic. Not only are they extremely time consuming, but both methods have issues with accuracy. That’s why we developed the WP4C.
Simply accurate. Simply fast. Simple to use.
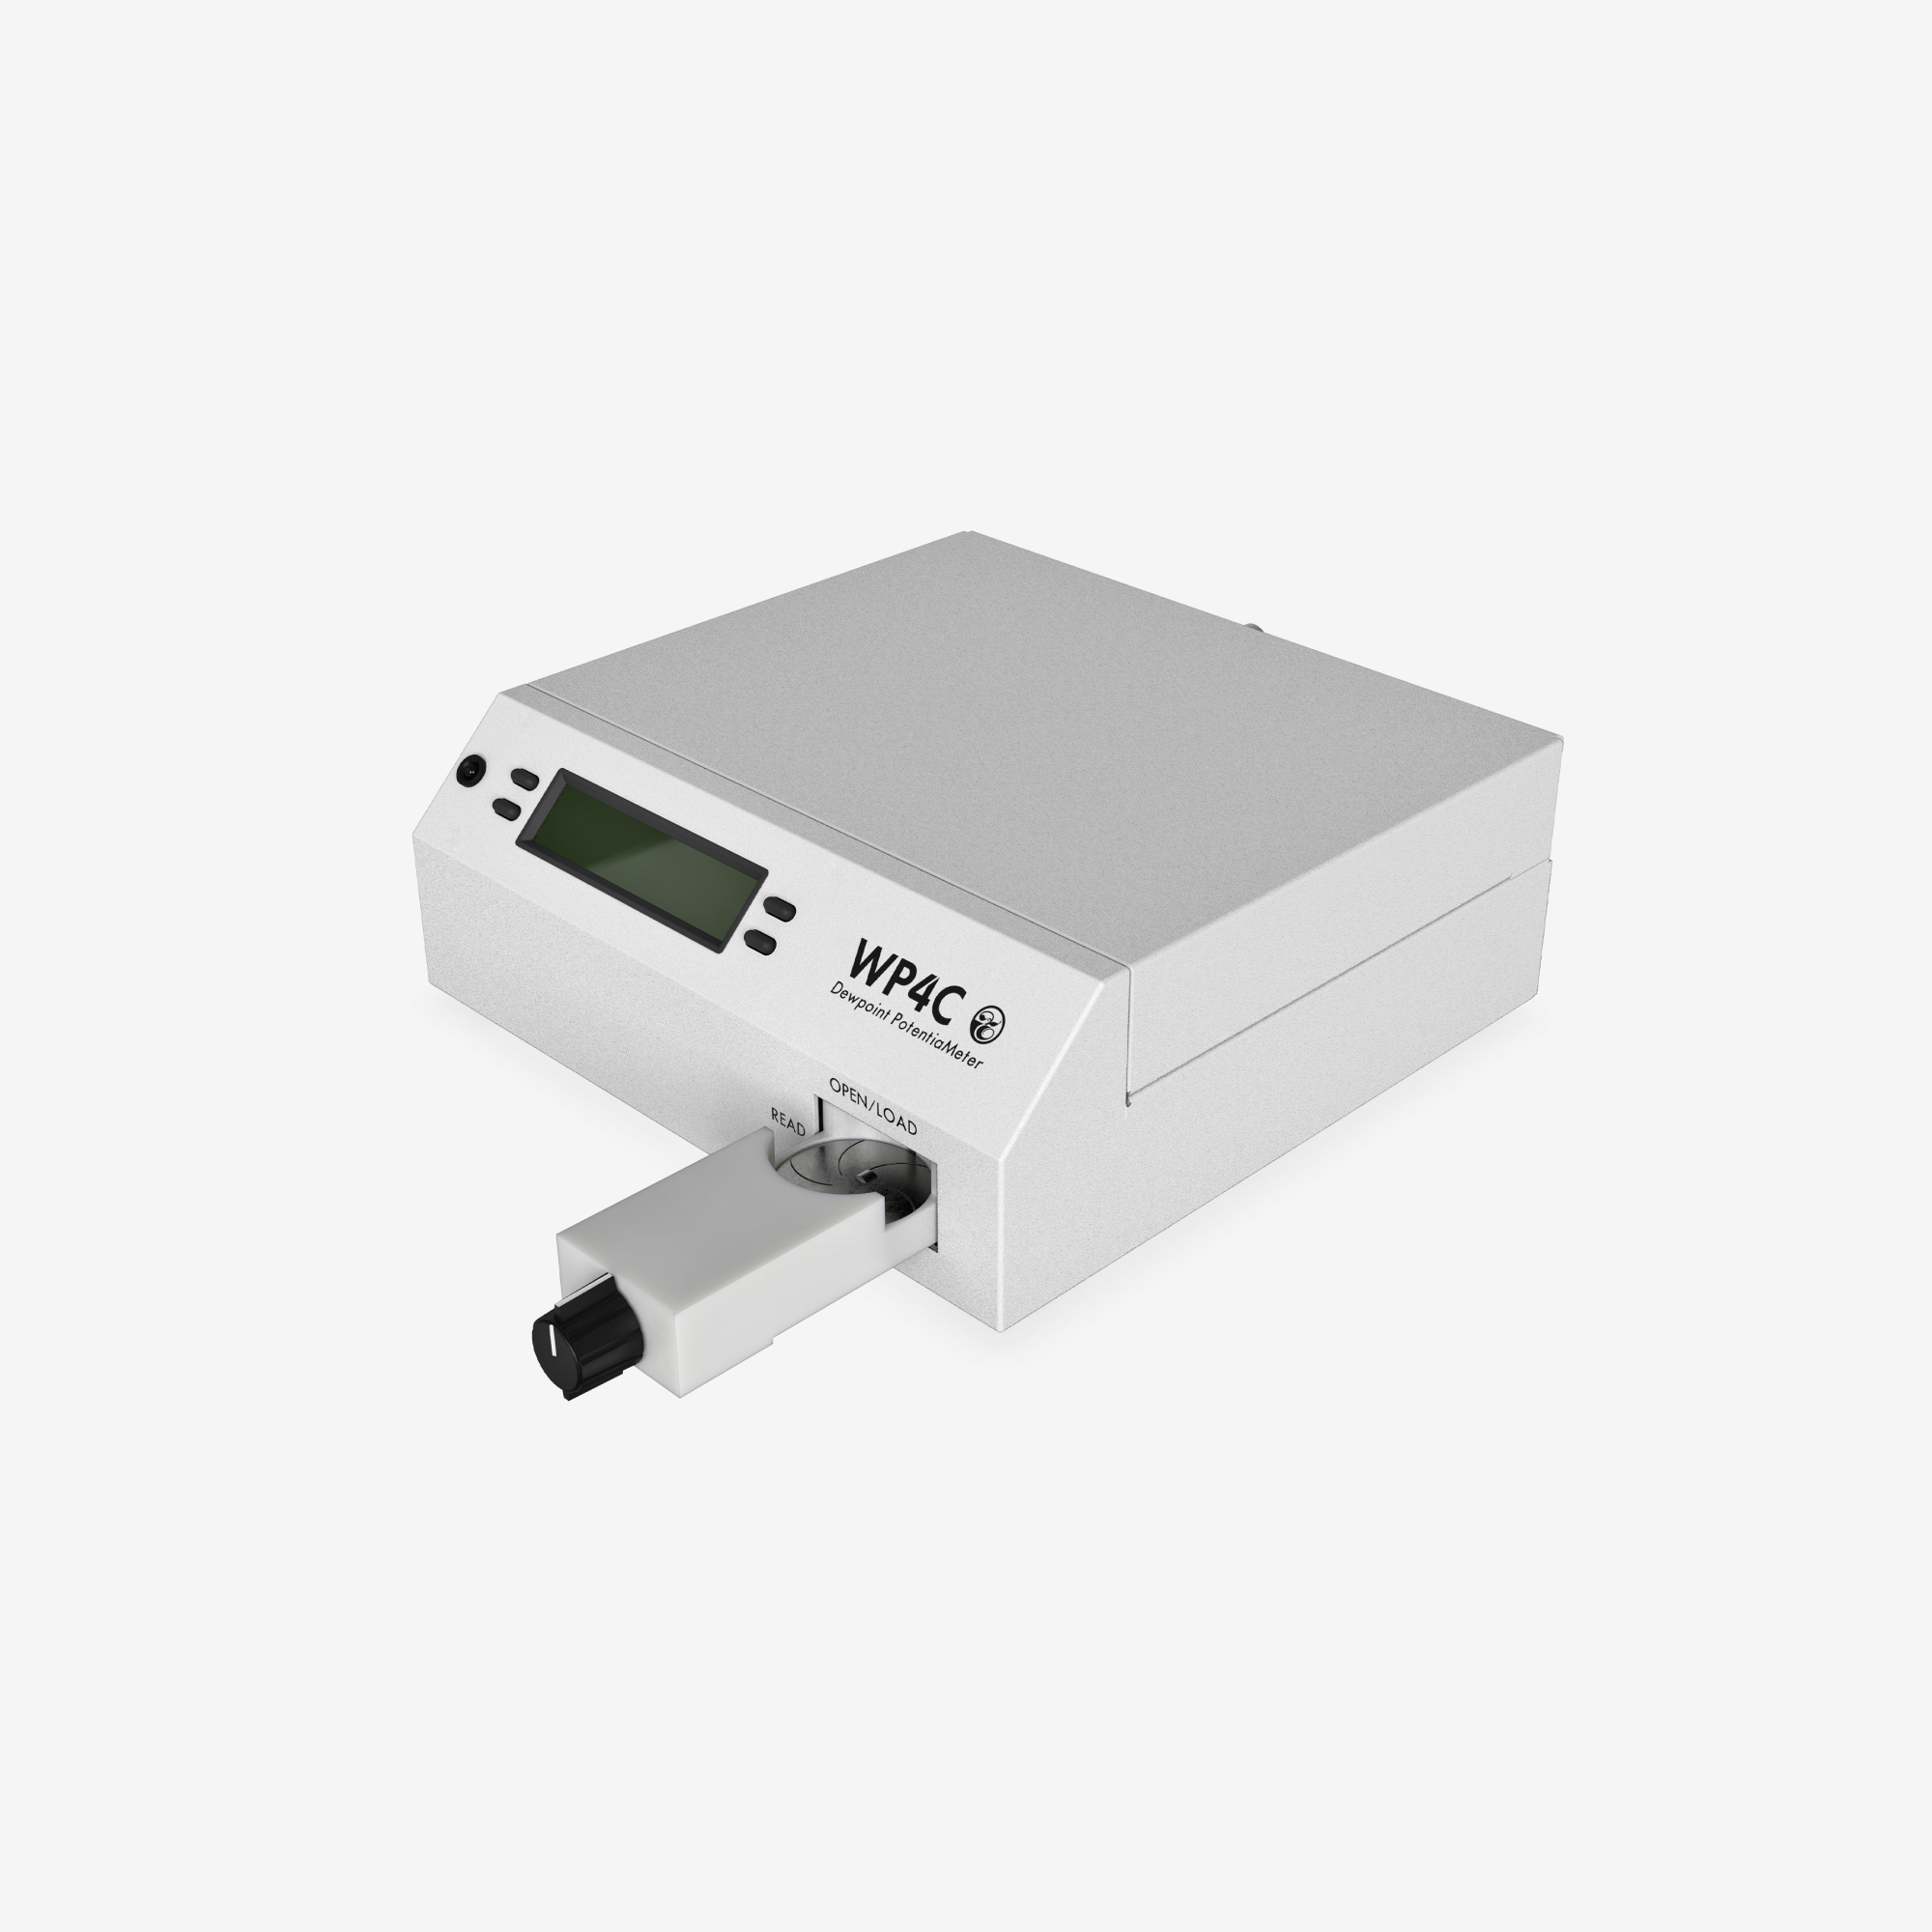
As world experts in water potential and soil suction, it wasn’t enough to engineer an instrument that delivered consistent accuracy. We also designed it to be easy to use and take only minutes to register measurements, even in dry soils. The WP4C is a complex instrument due to its versatility, but extremely easy to use with sample sizes up to 7 ml. Simply fill half of the cup with soil, leaves or seeds, and then equilibrate the sample.
Proven first-principles method based on fundamental physics
The WP4C is so accurate, it’s used to calibrate other measurement methods and has been published extensively. Why? The dew point sensor inside the WP4C is a primary measure of water potential, not some secondary parameter merely correlated with water potential. It measures the combined matric and osmotic potential using fundamental thermodynamics and a finely-tuned calibration. Here’s how it works:
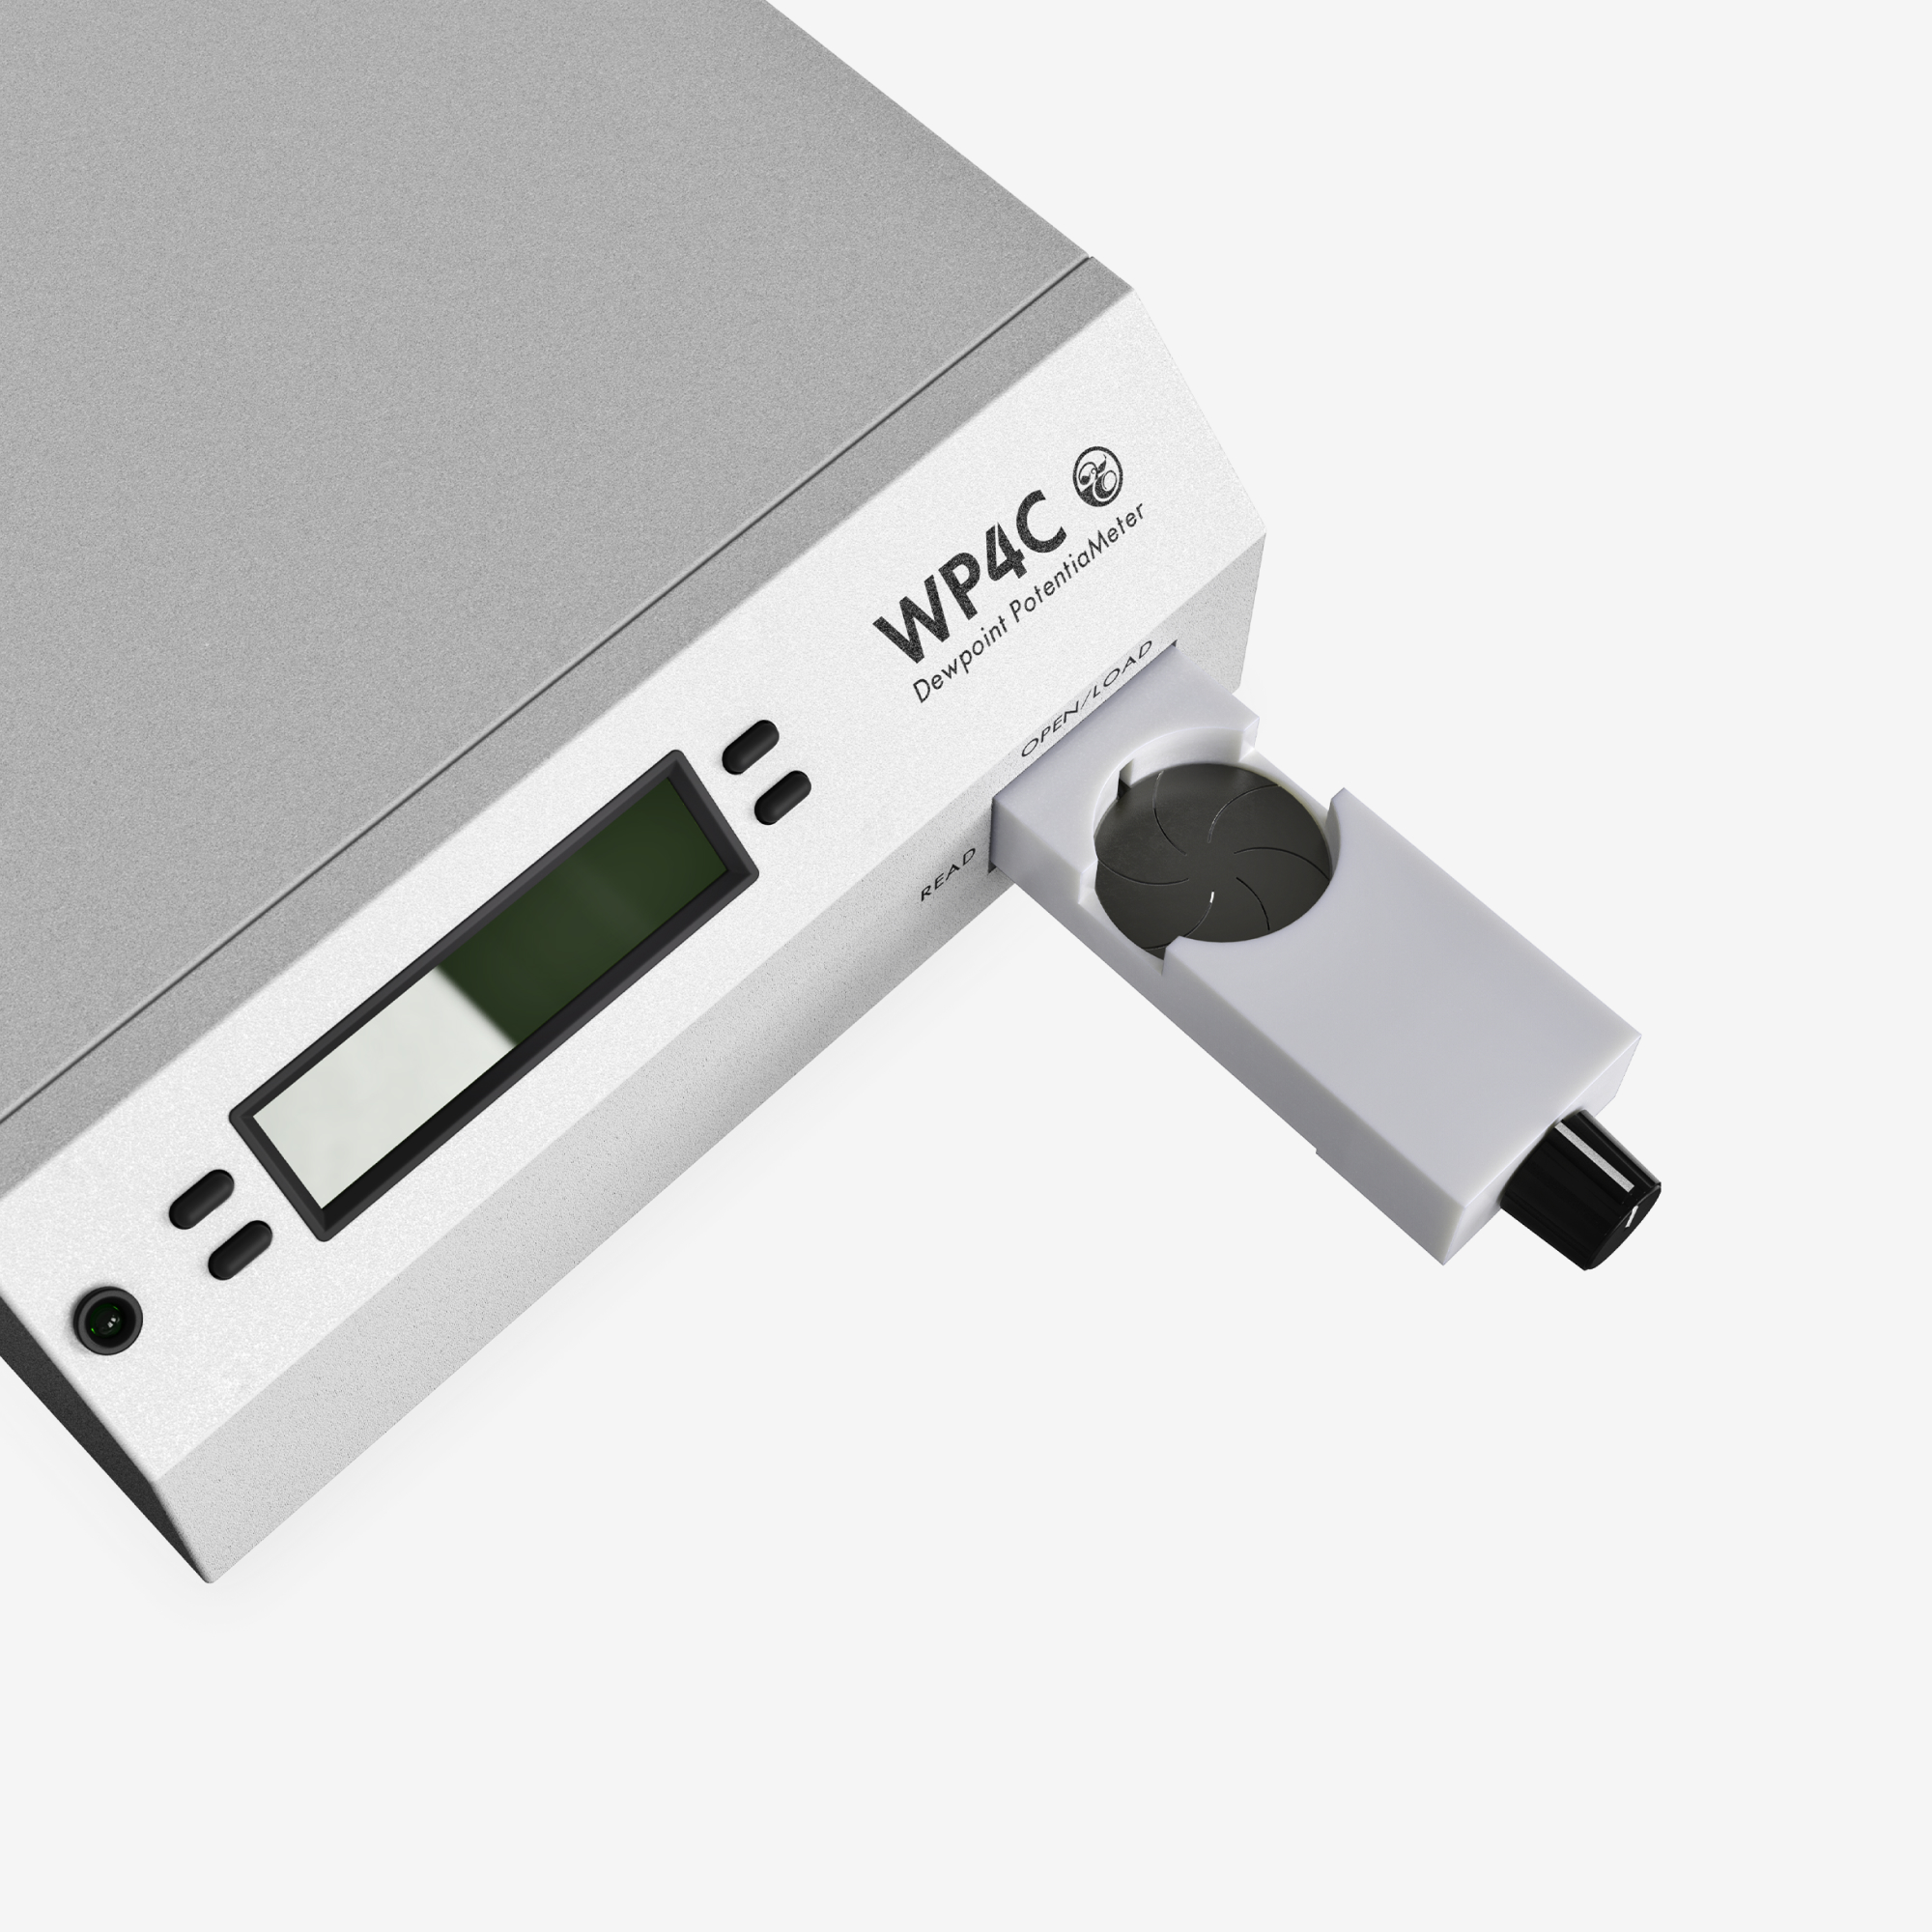
The WP4C determines the relative humidity of the air above a sample in a sealed chamber (conforms to ASTM D6836). Once the sample comes into equilibrium with the vapor, relative humidity is determined using the chilled mirror method. This involves chilling a tiny mirror until dew starts to form. At the dew point, the WP4C measures both mirror and sample temperature within 0.001 °C. This allows for unparalleled accuracy in the –0.1 MPa to –300 MPa range so you can have full confidence in sample readings.
Unparalleled accuracy. Simplicity of use. Fast speeds.
Combine the WP4C with other LABROS instruments for a complete soil analysis. Add the PARIO for soil particle size analysis, and use data from the HYPROP and the KSAT to generate a hydraulic conductivity curve.
Only using partial curves? Get what you’ve been missing.
Now, generate full, high-resolution moisture release curves across the entire moisture range by combining WP4C data with HYPROP data. No other method generates a curve with this much detail, or with this little effort.
If you only need the dry end of the curve, the HYPROP FIT Software can be used to plug in water potential data collected by the WP4C for fitting different water retention models (i.e., van Genuchten, van Genuchten Bimodal, Fredlund & Xing, Brooks & Corey).
Save time and effort
The design of the WP4C is incredibly efficient in a number of ways. To start, you don’t have to spend a ton of time teaching your technicians. Plus, it allows for fast equilibration because of sophisticated temperature control. And a final feature that makes for a total time saver: it makes measurements on its own, so you’re free to attend to other things.
-
Feature summary
- Precise mode
- Chilled mirror dew point technique
- Fast equilibration
- Unparalleled accuracy in the -0.1 MPa to -300 MPa range
- Durable and easy to clean
- Easy to calibrate with saturated salt solutions
- Conforms to ASTM D6836
- Use with HYPROP to create a full soil moisture release curve
-
Specifications
-
TECHNICAL SPECIFICATIONS
Measurement Specifications
Water PotentialRange: 0 – -300 MPaResolution: NAAccuracy: ±0.05 MPa from 0 to –5 MPa
1% from –5 to –300 MPaNOTE: All vapor pressure instruments (including the WP4C) are limited by accuracy in the wet end of the water potential range. The range of 0 to −5 MPa has an accuracy of ±0.05 MPa. For example, a measurement of −0.1 MPa has an accuracy of ±50% of the measurement and a measurement of −1 MPa has an accuracy of ±5%. The WP4C will not measure water potential accurately near field capacity (-0.033 MPa).TemperatureRange: 15.00 – 40.00 °CResolution: 0.10 °CAccuracy: ±0.20 °CRead TimeSoil Sample: ~10–15 min (precise mode)
<5 min (fast mode)Plant Sample: ~20 minNOTE: WP4C will display updated measurements approximately every 5 min until stoppedPhysical Specifications
Case DimensionsLength: 24.1 cm (9.5 in)Width: 22.9 cm (9.0 in)Height: 8.9 cm (3.5 in)Case MaterialPowder painted aluminumUniversal Power110.0000 – 220.0000 V AC 50/60 HzSensor TypesChilled-mirror dew point sensor
Infrared temperature sensorCable TypeStandard RS-232 to USB cable (included)Display20 x 2 alphanumeric LCD with backlightingSample Cup Capacity15 mL (0.5 oz) full
7 mL (0.25 oz) recommendedOperating Temperature RangeMinimum: 5.00 °CTypical: NAMaximum: 40.00 °CWeight3.2 kg (7.1 lb)Data CommunicationsRS-232A serial
8-data bit ASCII code
9,600 baud, no parity
1 stop bitOther
ComplianceEM ISO/IEC 17050:2010 (CE Mark)
Compatible standard: ASTM D6836-07GSA
-
Support / FAQ
-
WP4C ManualManualPDF, 1.766MBWP4C Quick StartQuickstart GuidePDF, 1.428MBLABROS Soilview and Soilview-Analysis SoftwareSoftwareEXE, 121MBWP4C Firmware UpdaterFirmwareEXE, 1.3MBSafety Data Sheet 0.50 mol/kg Potassium Chloride (KCL) (0.984AW)ManualPDF, 0.07673MB(German Translation) Safety Data Sheet 0.50 mol/kg Potassium Chloride (KCL) (0.984AW)ManualPDF, 0.0678MB(Italian Translation) Safety Data Sheet 0.50 mol/kg Potassium Chloride (KCL) (0.984AW)ManualPDF, 0.134MBApp note: WP4C measurement with LABROSInstructionsPDF, 807 KBHOW TO CREATE A FULL MOISTURE RELEASE CURVE USING THE WP4C AND HYPROPInstructionsPDF
-
WP4C FAQs
- How do I clean the WP4C?
- See the WP4C cleaning video here.
- We have a HYPROP and WP4C. What challenges can we expect with analyzing high-clay vertisol soils?
- This is a really good question. One of the main issues you will see with the high clay vertisols will be the shrinking of the samples during the measurements. You shouldn’t have too much of an issue with contact during the measurement. Due to the volume change during the measurement, the VWC measured by the HYPROP won’t correlate well with the actual change in volume. The VWC and bulk density will be based on the saturated volume and density of the soil samples. One way to approach this is to convert to gravimetric water contents.
- Does the field capacity vary depending on whether the soil has previously been in a dry or wet state? If so, what error margin might that cause if I plan irrigation scheduling according to FC?
- This is true. What you are looking at is the effect of hysteresis, which is generally not a big concern. Depending on the soil type and how big the hysteresis effect is, it can actually shift the field capacity point slightly. If you are concerned about this, you may want to use water potential to schedule irrigation, for example with the TEROS 21 or a tensiometer. If you’d like more information about this, contact customer support.
- How can you measure capillary water potential?
- Capillary water potential is tied to matric potential. So if you are measuring matric potential with a tensiometer or a TEROS 21, you are essentially measuring the effect of the capillaries or those different pore sizes. You can also use the HYPROP. The WP4C will also work assuming the soil has a negligible osmotic potential.
- Do matric potential sensor readings include osmotic potential?
- This depends on what type of instrument you are using to measure the potential. For example, tensiometers, granular matric sensors, and the TEROS 21 ONLY measure matric potential. So these sensors are blind to osmotic potential. Laboratory instruments like the WP4C measure both osmotic and matric potential. But in terms of field sensors, there aren’t any that give both components.
- We monitor soil moisture using water content. How can we integrate this into a soil moisture release curve?
- One of the best ways to do this is to take some samples and measure the soil moisture release curve for that soil, generating a functional relationship. Then you can take that curve and use your water content values to set your irrigation points through your release curve function. Another option is modeling it. If you know some information about the soil type and pedology, there are pedotransfer functions you can use by inputting those variables, and it will predict a soil moisture release curve. This method is not as accurate, but it’s a possible option.
- Which depths should I consider for active roots in maize for irrigation management?
- You can refer to the literature for rooting depths of maize. As for the sensors, we recommend a combination of TEROS 12 soil moisture sensors and TEROS 21 matric potential sensors to get the whole picture.
- What modeling programs can you use to model soil moisture release curves?
- There are a few different models out there to model soil moisture release curves. ROSETTA is a program from the US Salinity lab that has been around for a long time. Hydrus is another tool that can be used to model soil moisture release curves. One thing to remember is that these models don’t take into account all of the factors that can change a soil moisture release curve. So if you decide to model your soil moisture release curve, remember they aren’t perfect.
- Now VWC trends are used to determine field capacity and stress onset. Is this more accurate method than water potential?
- This is one approach to take. The issue with using water content measurements is you have to wait until you observe stress occurring to make this type of set point. We recommend a physical water potential measurement as a better way to determine a stress set point. As for field capacity, you can still use the physical measurements to set your field capacity point. The most important thing to understand is that the traditional -33 kPa point for field capacity is not a good rule of thumb to follow.
- Do private chemical labs carry out soil water retention curve analysis? or just university labs?
- There aren’t many private labs that offer retention curve services; however, METER does offer soil moisture release curve services.
- How do you develop a soil moisture release curve in highly variable soils?
- If you have a site with highly variable soils you will need to generate a curve for each individual soil type. One approach would be to map out the site and select the soil types of most importance and then create soil moisture release curves for those soils.
- What is matric potential?
- Matric potential is the force that would need to be exerted to move a water molecule from the surface of a soil particle. For example, a matric potential of -100 kPa would require a force of -101 kPa to pull that water molecule off of the soil particle. It is one component of the total water potential. Learn more about the different components of water potential here.
- What are the main differences between WP4, WP4-T, and WP4C?
- The WP4, first model, doesn’t have a couple of features of the newer dewpoint water potential models. The second model, WP4-T, has temperature control of the sample. The third model, WP4C, in addition to temperature control of the block, has improved accuracy in the wet range by being able to resolve temperature differences of 0.001 degrees between the sample and the mirror. The WP4-T can only resolve temperature differences of 0.01 degrees between the sample and the mirror. This results in an improvement in accuracy of 0.5 MPa in the WP4C. The range of the WP4C has also been extended to -300 MPa.
- How do you convert MPa to pF?
- You can convert MPa to cm of suction by dividing MPa by -9.787×10⁻⁴. pF is then the log base 10 of cm of suction.
- What measurement mode should I use to read my samples?
-
It depends on the expected water potential range of your sample. Very dry samples (< -40 MPa) can be run in fast mode with no loss of accuracy. Precise mode should be used for optimum accuracy of samples up to ~ -0.50 MPa. Continuous mode is recommended for wetter samples that require extreme temperature equilibrium for maximum precision.
Please note that the time to completion is not determined in continuous mode; the user must determine when the reading levels off and the sample has reached equilibrium.
- What causes long read times in my WP4C?
-
Contamination of the sample chamber is the primary cause of long read times. The WP4C relies on equilibration of water vapor in the chamber with the sample. A dirty sample chamber can have samples that adsorb or desorb water vapor. This can lead to longer read times but is usually rectified by a good cleaning.
Unstable temperatures can also be a problem. Take care to provide a stable temperature environment for your WP4C and to keep your samples close to the temperature at which you intend to read them.
-
Resources / Publications
-
Educational links
- The researcher’s complete guide to water potential
- Nature Geoscience peer reviewed article: Confronting the water potential information gap
- Webinar: 5 reasons you’re getting less accurate soil moisture release curves
- How to model plant available water
- Plant available water: How do I determine field capacity and permanent wilting point?
- Determining the -15 Bar (Permanent Wilt) Water Content of Soils with the WP4C
- Measuring soil suction: Why filter paper isn’t good enough
- Lab vs. field instruments: Why you should use both
- Soil moisture release curves: Why you need them. How to use them.
- Webinar: Soil moisture 201: Moisture release curves—revealed
- Water potential 101: making use of an important tool
- Webinar: Water potential 201: Choosing the right instrument
- Webinar: Soil moisture: why water content can’t tell you everything
- Classification of Expansive Soils using the WP4C
- Measurement of Leaf Water potential using the WP4C
- How to Measure Specific Surface of Soil With the WP4C
- Estimating Relative Humidity in Soil
- Seed longevity is enhanced by controlling water potential
- Water potential: the key to successful seed priming
- Effects of Sample Disturbance on Soil Water Potential Measurements with the WP4C
- Soil moisture master class
Support links
- WP4C cleaning video
- Manuals and software
- How to create a full moisture release curve using the WP4C and HYPROP
- App note: WP4C measurement using LABROS SOILVIEW software
Case studies
-
Selected Publications
Listed below are a few examples of cited publications for the WP4C potentiameter. This list is not exhaustive.
2020
- da Silva, Alisson Jadavi Pereira, Everton Alves Rodrigues Pinheiro, and Quirijn de Jong van Lier. “Determination of soil hydraulic properties and its implications for mechanistic simulations and irrigation management.” Irrigation Science (2020): 1-12. (Article link).
- Domínguez-Niño, Jesús María, Gerard Arbat, Iael Raij-Hoffman, Isaya Kisekka, Joan Girona, and Jaume Casadesús. “Parameterization of Soil Hydraulic Parameters for HYDRUS-3D Simulation of Soil Water Dynamics in a Drip-Irrigated Orchard.” Water 12, no. 7 (2020): 1858. (Article link).
- Fontanet, Mireia, Elia Scudiero, Todd H. Skaggs, Daniel Fernàndez-Garcia, Francesc Ferrer, Gema Rodrigo, and Joaquim Bellvert. “Dynamic Management Zones for Irrigation Scheduling.” Agricultural Water Management 238 (2020): 106207. (Article link).
- Jackisch, Conrad, Kai Germer, Thomas Graeff, Ines Andrä, Katrin Schulz, Marcus Schiedung, Jaqueline Haller-Jans et al. “Soil moisture and matric potential–an open field comparison of sensor systems.” Earth System Science Data 12, no. 1 (2020). (Article link).
- Kassaye, Kassu Tadesse, Julien Boulange, Hirotaka Saito, and Hirozumi Watanabe. “Monitoring soil water content for decision supporting in agricultural water management based on critical threshold values adopted for Andosol in the temperate monsoon climate.” Agricultural Water Management 229 (2020): 105930. (Article link).
- Kumagai, Etsushi, and Tomoki Takahashi. “Soybean (Glycine max (L.) Merr.) Yield Reduction due to Late Sowing as a Function of Radiation Interception and Use in a Cool Region of Northern Japan.” Agronomy 10, no. 1 (2020): 66. (Article link).
2019
- Bonfante, A., E. Monaco, P. Manna, R. De Mascellis, A. Basile, M. Buonanno, G. Cantilena et al. “LCIS DSS—An irrigation supporting system for water use efficiency improvement in precision agriculture: A maize case study.” Agricultural Systems 176 (2019): 102646. (Article link).
- Gong, Xue-Wei, Guang-Hui Lü, Xue-Min He, Binoy Sarkar, and Xiao-Dong Yang. “High air humidity causes atmospheric water absorption via assimilating branches in the deep-rooted tree Haloxylon ammodendron in an arid desert region of Northwest China.” Frontiers in Plant Science 10 (2019): 573. (Article link).
- Khan, Abdur Rahim, L. G. Reichmann, J. C. Ibal, J. H. Shin, Y. Liu, Harold Collins, B. LePage, and N. Terry. “Variation in pickleweed root-associated microbial communities at different locations of a saline solid waste management unit contaminated with petroleum hydrocarbons.” PloS one 14, no. 10 (2019). (Article link).
- Kreszies, Tino, Nandhini Shellakkutti, Alina Osthoff, Peng Yu, Jutta A. Baldauf, Viktoria V. Zeisler‐Diehl, Kosala Ranathunge, Frank Hochholdinger, and Lukas Schreiber. “Osmotic stress enhances suberization of apoplastic barriers in barley seminal roots: analysis of chemical, transcriptomic and physiological responses.” New Phytologist 221, no. 1 (2019): 180-194. (Article link).
- Peng, Zhengkai, Linlin Wang, Junhong Xie, Lingling Li, Jeffrey A. Coulter, Renzhi Zhang, Zhuzhu Luo, Jana Kholova, and Sunita Choudhary. “Conservation Tillage Increases Water Use Efficiency of Spring Wheat by Optimizing Water Transfer in a Semi-Arid Environment.” Agronomy 9, no. 10 (2019): 583. (Article link).
2018
- Ren, Junping, and Sai K. Vanapalli. “Comparison of soil‐freezing and soil‐water characteristic curves of two Canadian soils.” Vadose Zone Journal 18, no. 1 (2019): 1-14. (Article link).
- Desa, Sachit AJ, and Brendan T. Scott. “Inferring soil water characteristics for adelaide clay using fractal theory.” Aust Geomech J 53 (2018): 127-135. (Article link).
- Karagoly, Yahya, Snehasis Tripathy, Peter John Cleall, and Talib Mahdi. “Suction measurements by a fixed-matrix porous ceramic disc sensor.” In Proceedings of the 7th International Conference on Unsaturated Soils, Hong Kong. 2018. (Article link).
- Wang, Heng, Xiangjie Qian, Lan Zhang, Sailong Xu, Haifeng Li, Xiaojian Xia, Liankui Dai, Liang Xu, Jingquan Yu, and Xu Liu. “A method of high throughput monitoring crop physiology using chlorophyll fluorescence and multispectral imaging.” Frontiers in Plant Science 9 (2018): 407. (Article link).
2016
- Kelleners, Thijs J., Jeremy Koonce, Rose Shillito, Jelle Dijkema, Markus Berli, Michael H. Young, John M. Frank, and W. J. Massman. “Numerical modeling of coupled water flow and heat transport in soil and snow.” Soil Science Society of America Journal 80, no. 2 (2016): 247-263. (Article link).
2014
- Germino, Matthew J., and Keith Reinhardt. “Desert shrub responses to experimental modification of precipitation seasonality and soil depth: relationship to the two‐layer hypothesis and ecohydrological niche.” Journal of Ecology 102, no. 4 (2014): 989-997. (Article link).
- Korovetska, Halyna, Ondřej Novák, Oldřich Jůza, and Vit Gloser. “Signalling mechanisms involved in the response of two varieties of Humulus lupulus L. to soil drying: I. changes in xylem sap pH and the concentrations of abscisic acid and anions.” Plant and Soil 380, no. 1-2 (2014): 375-387. (Article link).
2013
- Mann, J. Jeremiah, Jacob N. Barney, Guy B. Kyser, and Joseph M. DiTomaso. “Root system dynamics of Miscanthus× giganteus and Panicum virgatum in response to rainfed and irrigated conditions in California.” Bioenergy Research 6, no. 2 (2013): 678-687. (Article link).
- Yu, Tengfei, Qi Feng, Jianhua Si, Haiyang Xi, Zongxing Li, and Aifang Chen. “Hydraulic redistribution of soil water by roots of two desert riparian phreatophytes in northwest China’s extremely arid region.” Plant and Soil 372, no. 1-2 (2013): 297-308. (Article link).
2012
- McLaughlin, Daniel L., Mark T. Brown, and Matthew J. Cohen. “The ecohydrology of a pioneer wetland species and a drastically altered landscape.” Ecohydrology 5, no. 5 (2012): 656-667. (Article link).
2011
- Camposeo, Salvatore, and Gaetano Alessandro Vivaldi. “Short-term effects of de-oiled olive pomace mulching application on a young super high-density olive orchard.” Scientia Horticulturae 129, no. 4 (2011): 613-621. (Article link).
- Lazarus, Brynne E., James H. Richards, Victor P. Claassen, Ryan E. O’Dell, and Molly A. Ferrell. “Species specific plant-soil interactions influence plant distribution on serpentine soils.” Plant and Soil 342, no. 1-2 (2011): 327-344. (Article link).
2010
- Miller, Gretchen R., Xingyuan Chen, Yoram Rubin, Siyan Ma, and Dennis D. Baldocchi. “Groundwater uptake by woody vegetation in a semiarid oak savanna.” Water Resources Research 46, no. 10 (2010). (Article link).
-
Accessories

Request a quote
Fill out the form below to help us pair you with the right expert. We’ll prepare the information you request, then contact you as soon as possible.

