When choosing a grain size analysis method to create a grain size distribution curve, you’ll need to examine your research goals,
define what the measurement will be used for, and then weigh the pros and cons of each method. Keep in mind that the accuracy of soil texture analysis and the grain size distribution curve depends on the methods and tools you use.
What is grain size analysis or soil texture analysis?
A soil texture test or a soil grain size analysis (also called soil texture analysis or particle size analysis) is what researchers use to analyze the mineral fraction of a soil. Accurately measuring soil texture is critical for understanding soil water retention, hydraulic conductivity, soil water leaching, erosion potential, soil nutrient storage, organic matter dynamics, carbon sequestration capacity, and more.
Figure 1. PARIO is a modern instrument commonly used to automate soil grain size analysis or soil texture analysis.
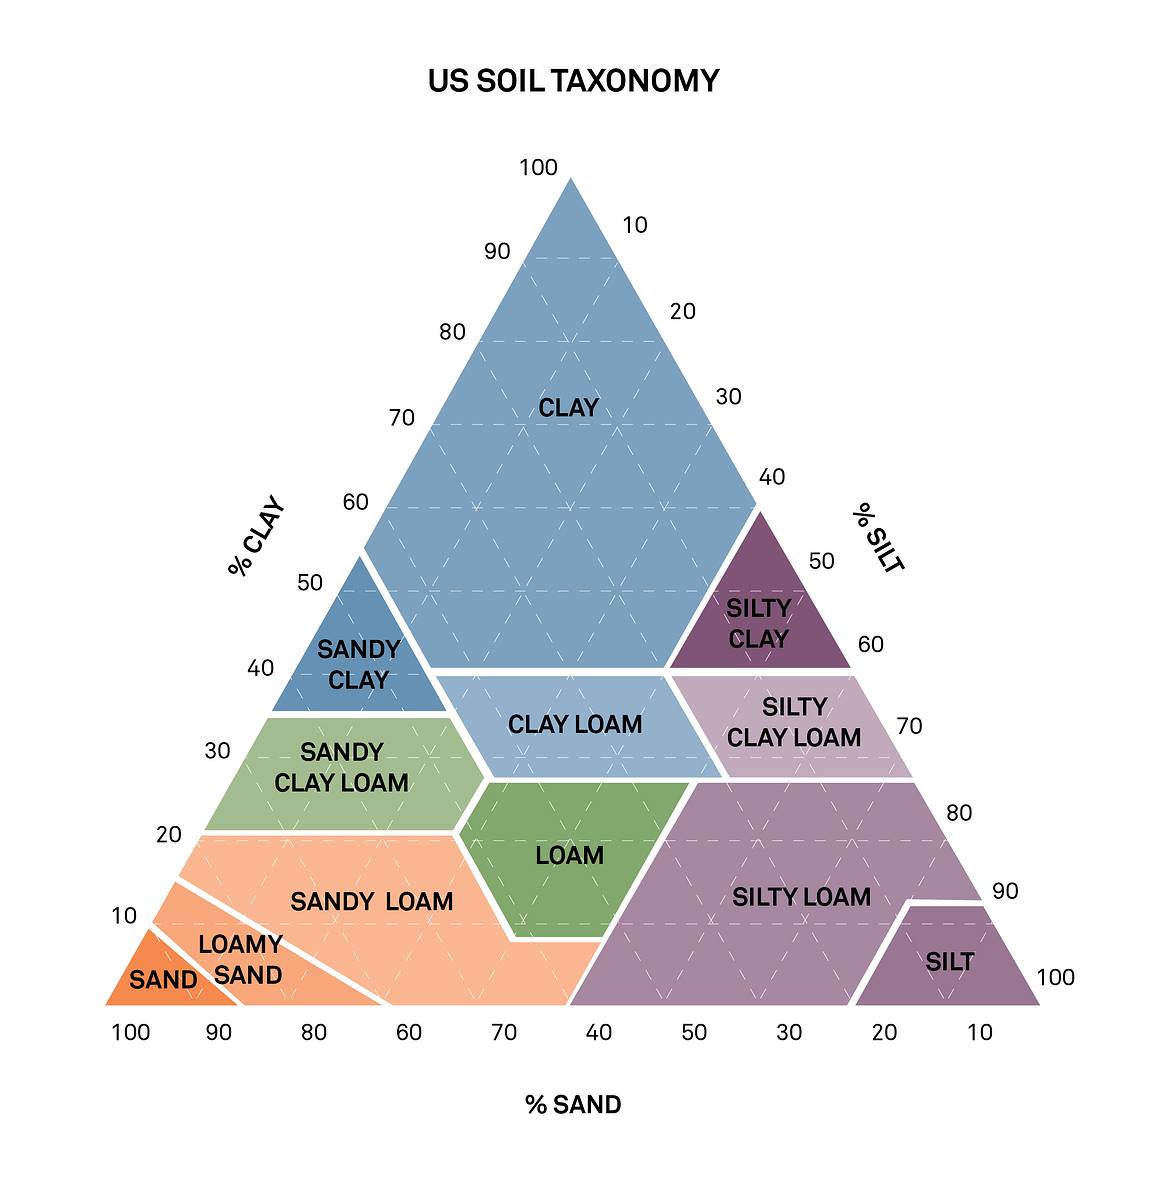
Soil texture or grain size is a fundamental soil physical property, and the grain size distribution or particle size distribution of a soil can range in particle size from stones and rocks all the way down to sub micron clays. Typically, when looking at grain size and soil texture, the soil particles will be smaller than 2000 microns. These soil particles are usually divided into three classes: sand, silt, and clay. A good example of this division is shown in the soil texture triangle (Figure 2), recognizable to those who are familiar with the USDA classification system. This triangle takes solid particle sizes and breaks them down into different fractions of sand, silt and clay.
Figure 2. US soil taxonomy: the breakdown of soil and soil texture into three different classes based on particle size.
Grain size analysis: Which method will work for you?
When choosing a grain size analysis method to create a grain size distribution curve, it’s important to understand how scientists traditionally performed these analyses and how the measurement has evolved over time.
Figure 3. Soil texture analysis has evolved from texturing by hand and sieve analysis to modern sedimentation and optical methods.
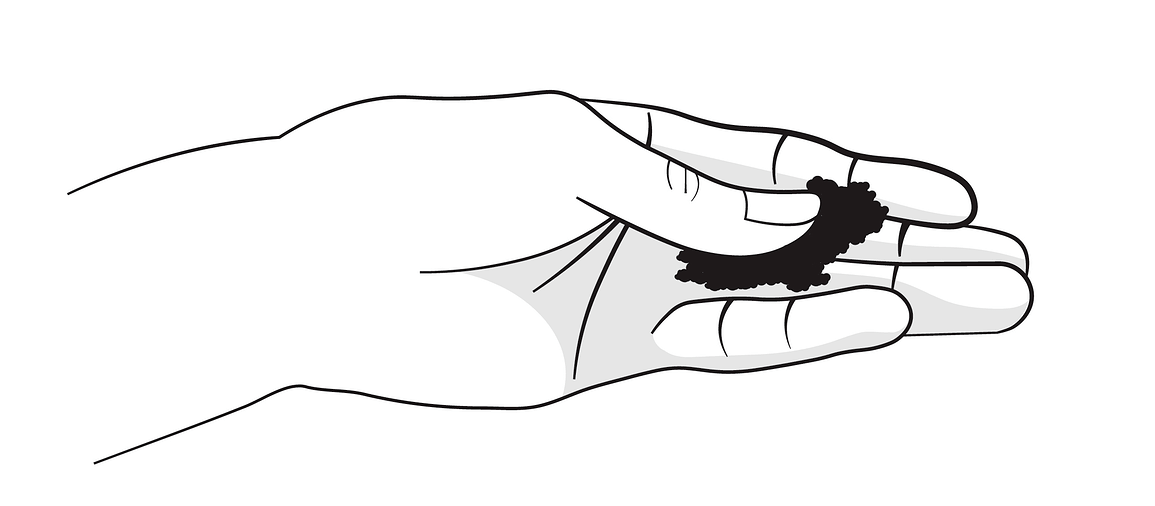
For many years, researchers and growers textured soil by hand, using ribbons, and checking the coarseness with our hands. While this method is still useful when trying to characterize soils in the field, it is subjective and prone to error. It works as a qualitative tool to do a quick characterization; however, today we have more accurate methods.
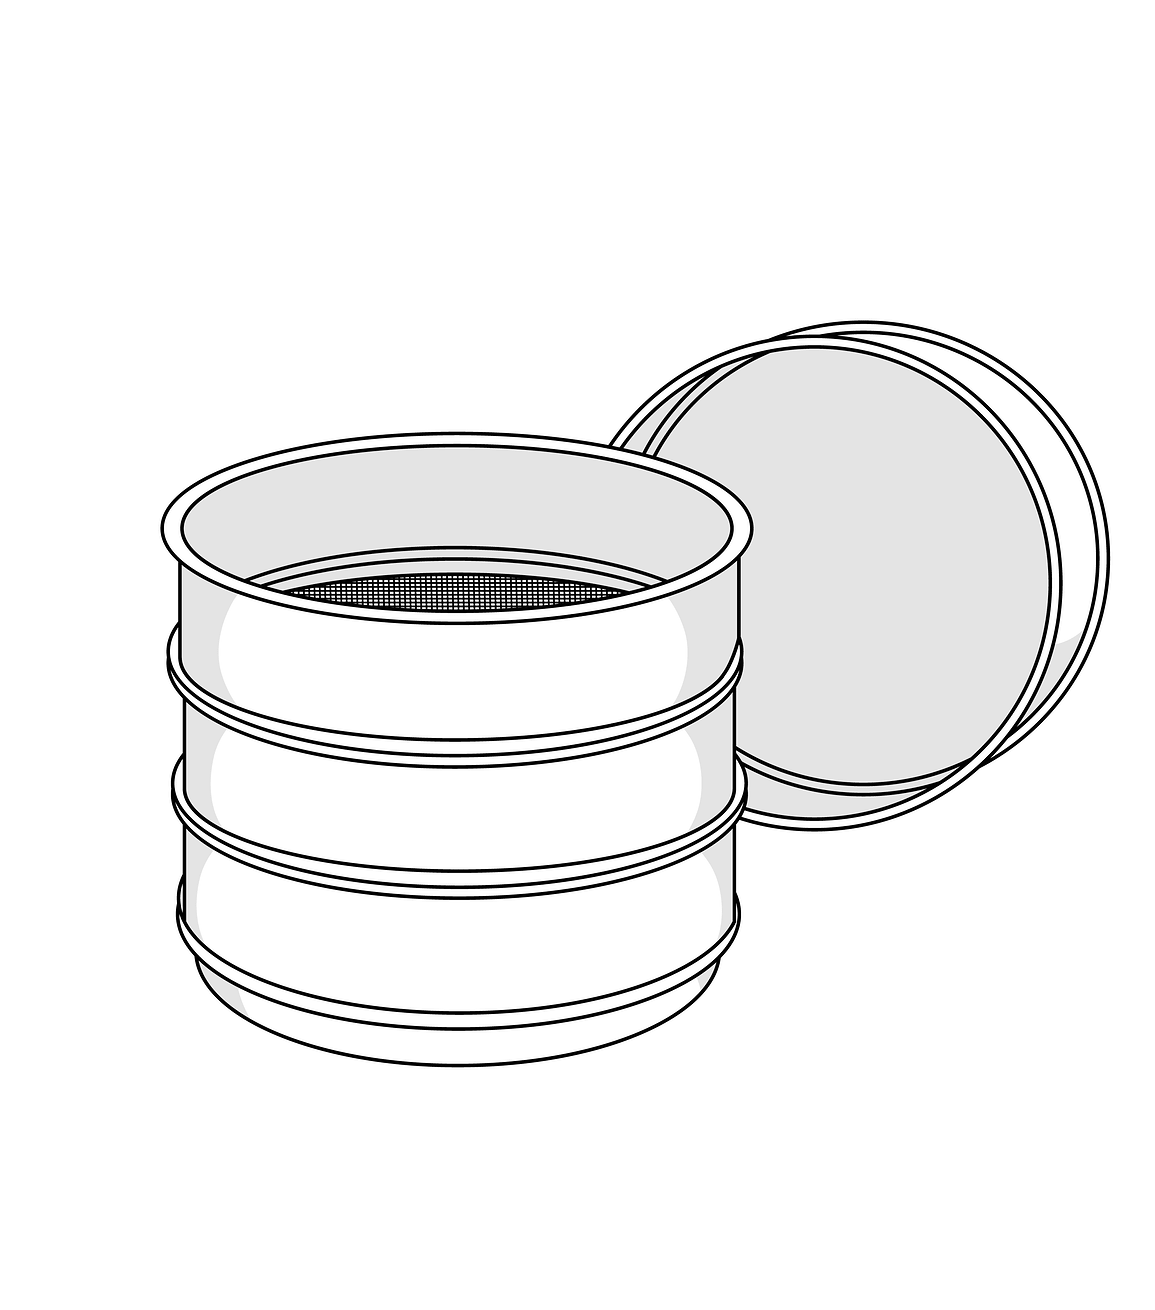
One method for getting accurate grain-size measurements is sieve analysis using ASTM-standard-size sieves (sometimes, other classification systems with different standards for sieve sizes are used). In this method, soil particle size is measured as soil passes through sieves to capture the different size ranges. Typically, this method is best for coarser fractions of soil.
Figure 4. One method for accurate grain size analysis is using ASTM-standard-size sieves.
When trying to characterize anything below 2000 microns or two millimeters, sedimentation methods based on Stokes law are more effective (Gee et al, 2002). The most common of these are the hydrometer and pipette methods (Gee et al, 2002). Advances in technology have also introduced new optical methods, such as X-ray attenuation, laser diffraction, and VisNIR spectroscopy. This article and the video below focus on comparing the fundamentals and scientific theory behind the most commonly used methods: sedimentation and laser diffraction.
What to know before you choose a grain size analysis method
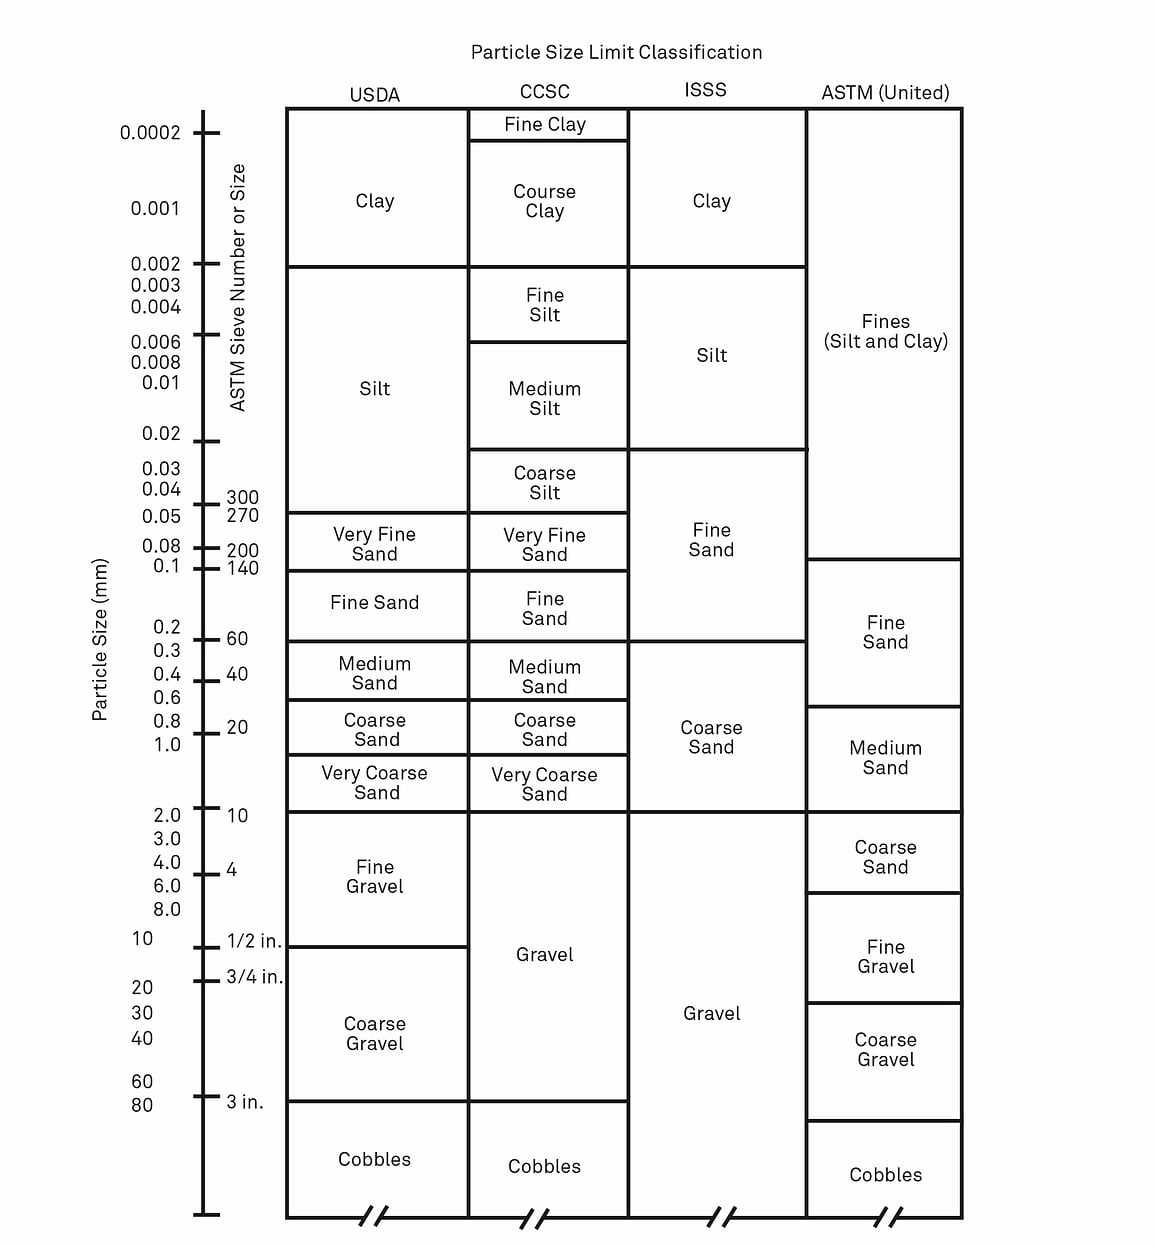
As mentioned, soil particles have a wide range of varying sizes, from stones and rocks (typically exceeding 0.25 meters in size) all the way down to micron clays (typically less than one micron), as shown in Figure 5. Here, we focus on particle measurements smaller than two mm or 2000 um, but all of these components (or size fractions) are a part of their classifications and need to be accounted for. Thus, when trying to characterize soils, you need to take into account any larger fractions that may be present.
Figure 5. Particle Size Limit Classification: “Particle size limits according to several current classification schemes, USDA, U.S. Department of Agriculture (Soil Survey Staff, 1075); CSSC, Canada Soil Survey Committee (McKeague, 1978; ISS, International Soil Sci. Soc. (Yong & Warkentin, 1966); ASTM (Unified), American Society for Testing and Materials (ASTM, D-2487, 200a).”
Figure 5 illustrates the various systems of size classification and soil classification, such as the USDA and the Unified Soil Classification System, both typically used in the US. The system you use may change depending on your use case and location (for example, there is a German standard for soil classification as well). The USDA classification system is used for agricultural and environmental purposes, whereas the Unified System is primarily used for engineering. It’s also important to understand which is needed when reporting your results. Who you report to and how the results will be used will dictate which type of classification system you choose.
What is a grain size distribution curve?
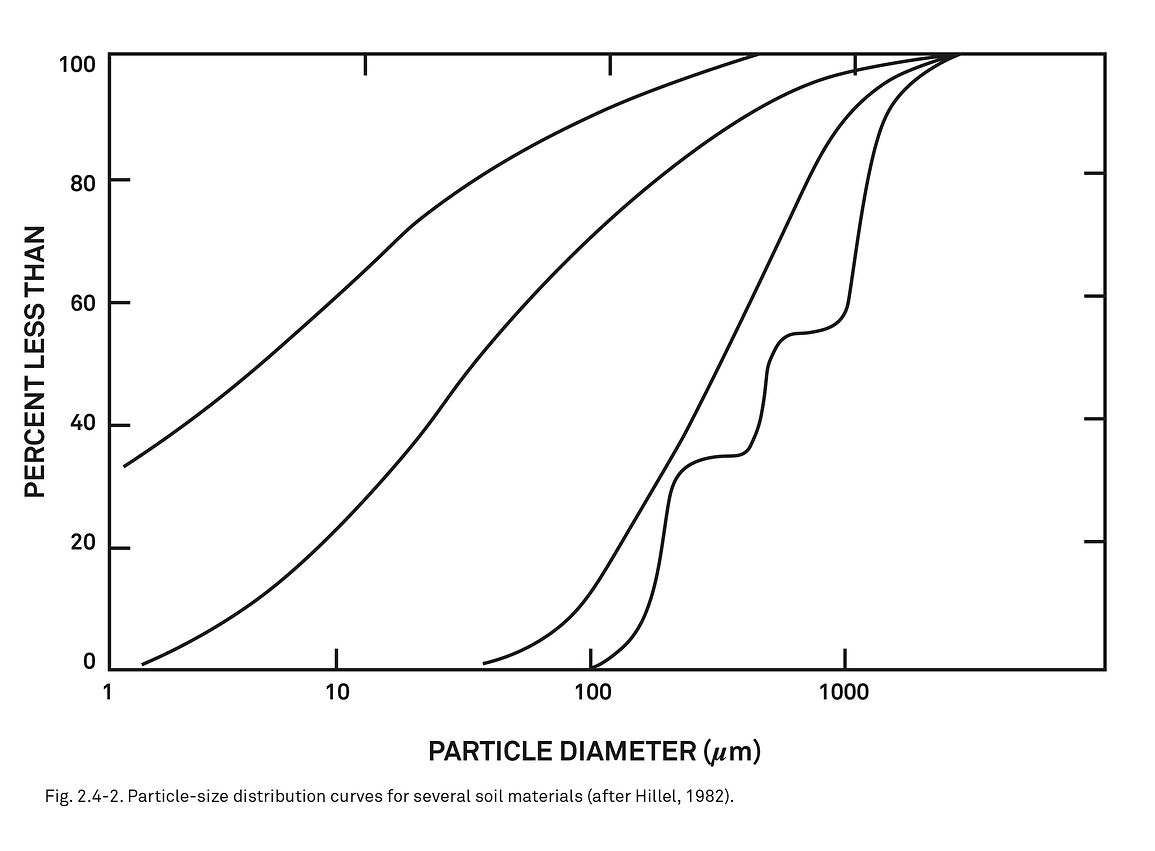
How the data will be presented is also an important thing to consider. There are many ways to present grain size analysis data. One of the most common is the cumulative particle size distribution curve (or grain size distribution curve). A grain size distribution curve, like the one in Figure 6, shows different soil textures and how their cumulative distributions look based on particle diameter.
Grain size analysis data can also be reported as a mass-based percentage of the different size classes. In other words, you can report size classes as percent clay, percent sand, and percent silt. And, an even simpler way to classify a soil is to report it as a soil texture.
The reporting method you choose depends on the level of detail you need. A cumulative particle size distribution curve (Figure 6) will provide the most detailed information, but distribution curve data aren’t always easy to interpret. Thus, depending on your use case, you may decide to use a simpler method.
Figure 6. Example of cumulative particle size distribution curves or grain size distribution curves for different soil types.
How soil is handled in its pretreatment is an important process as it can impact the accuracy of your data. Many researchers refer to the book, Methods of Soil Analysis, Part 4: Physical Methods for a reliable sample prep method. But there are other methods for pretreatment available, including the ASTM method and different methods in international standards.
For all measurement methods, the soil goes through an identical initial preparation. Sand, silt, and clay particles are separated for individual analysis. Organic matter, iron oxide, and organic carbon may also be removed (if present in significant amounts) because they can interfere with the measurement.
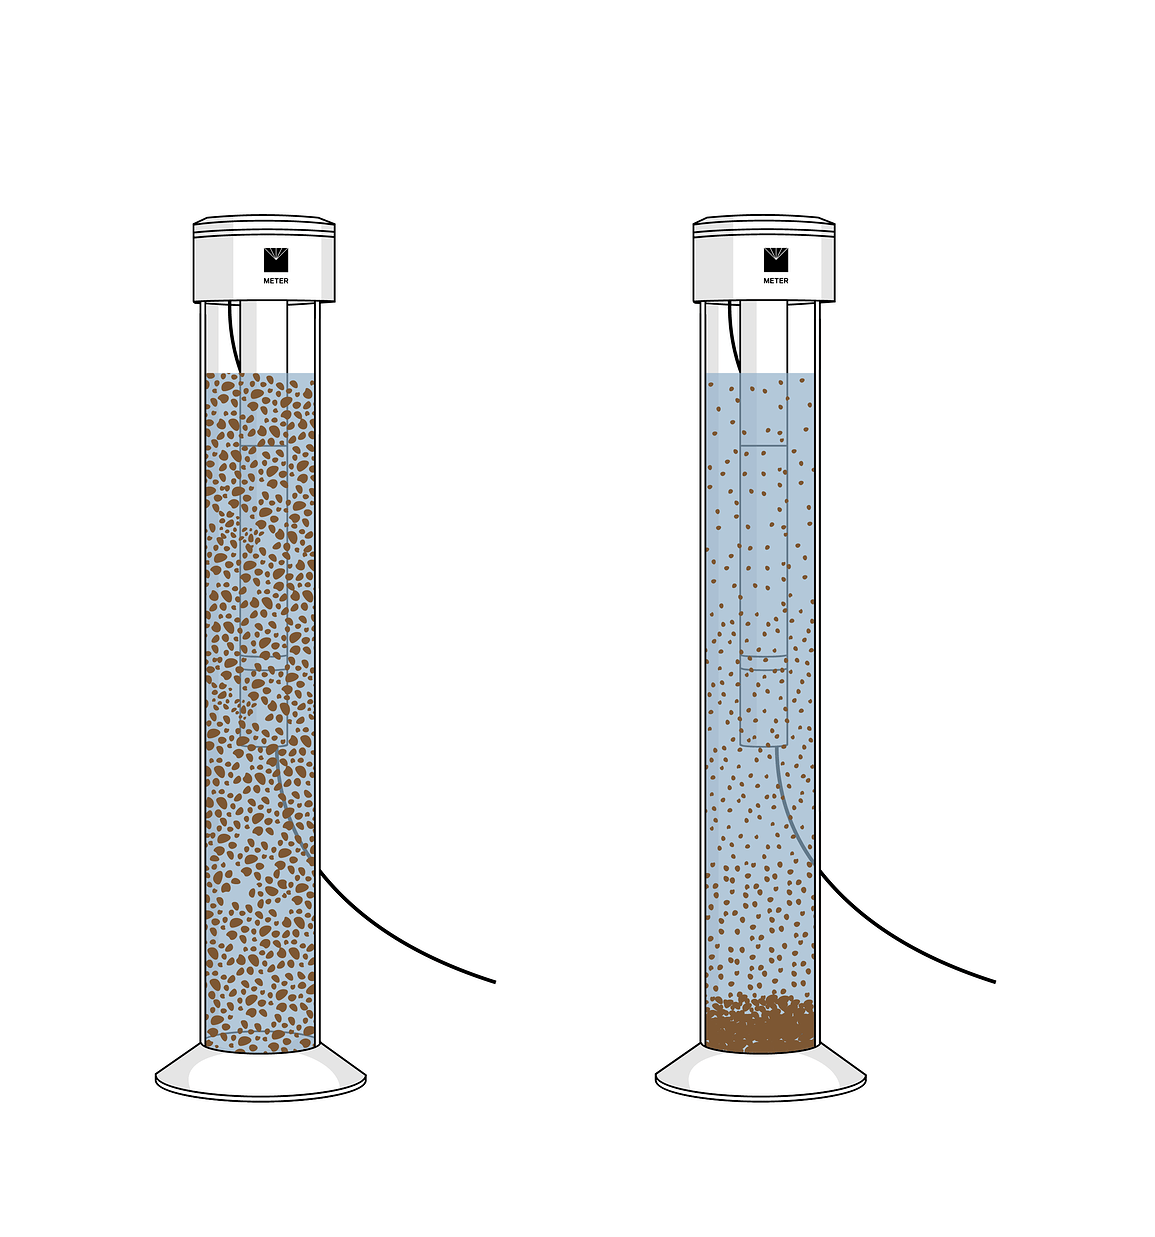
Some of the most commonly used methods are based on sedimentation and Stokes law. Sedimentation analysis relies on the relationship that exists between settling velocity and particle diameter. Particles are put into suspension in an aqueous solution, and over time, these particles will fall, or settle, at various rates depending on their particle size (Figure 7).
Figure 7. An example of the sedimentation method for soil particle size analysis.
This relationship was first defined in 1851 by George Gabriel Stokes, an Irish-English physicist from the University of Cambridge who developed what is now known as Stokes law.
There are some basic assumptions behind Stokes law and the sedimentation-based methods. These assumptions are:
Terminal velocity is attained as soon as settling begins
Resistance to settling is entirely due to the viscosity of the fluid
All particles are smooth and spherical
There is no interaction between the individual particles in the solution
These assumptions are not perfect, but even with potential issues from these assumptions, sedimentation methods are well established and have been tested extensively with accurate results. Understanding this will help when deciding between different measurement methods.
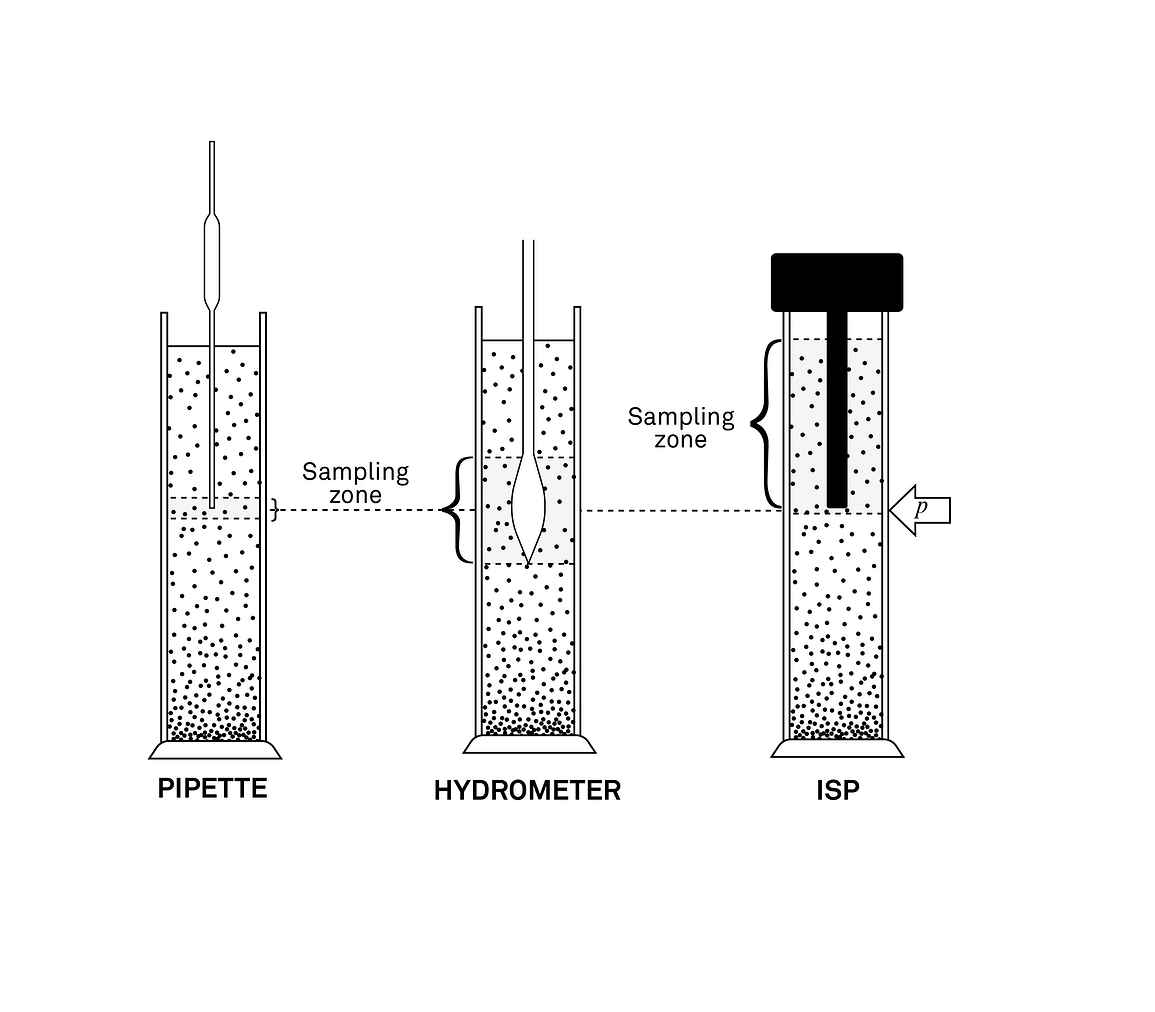
Figure 8. A visual of the three common sedimentation techniques for grain size analysis.
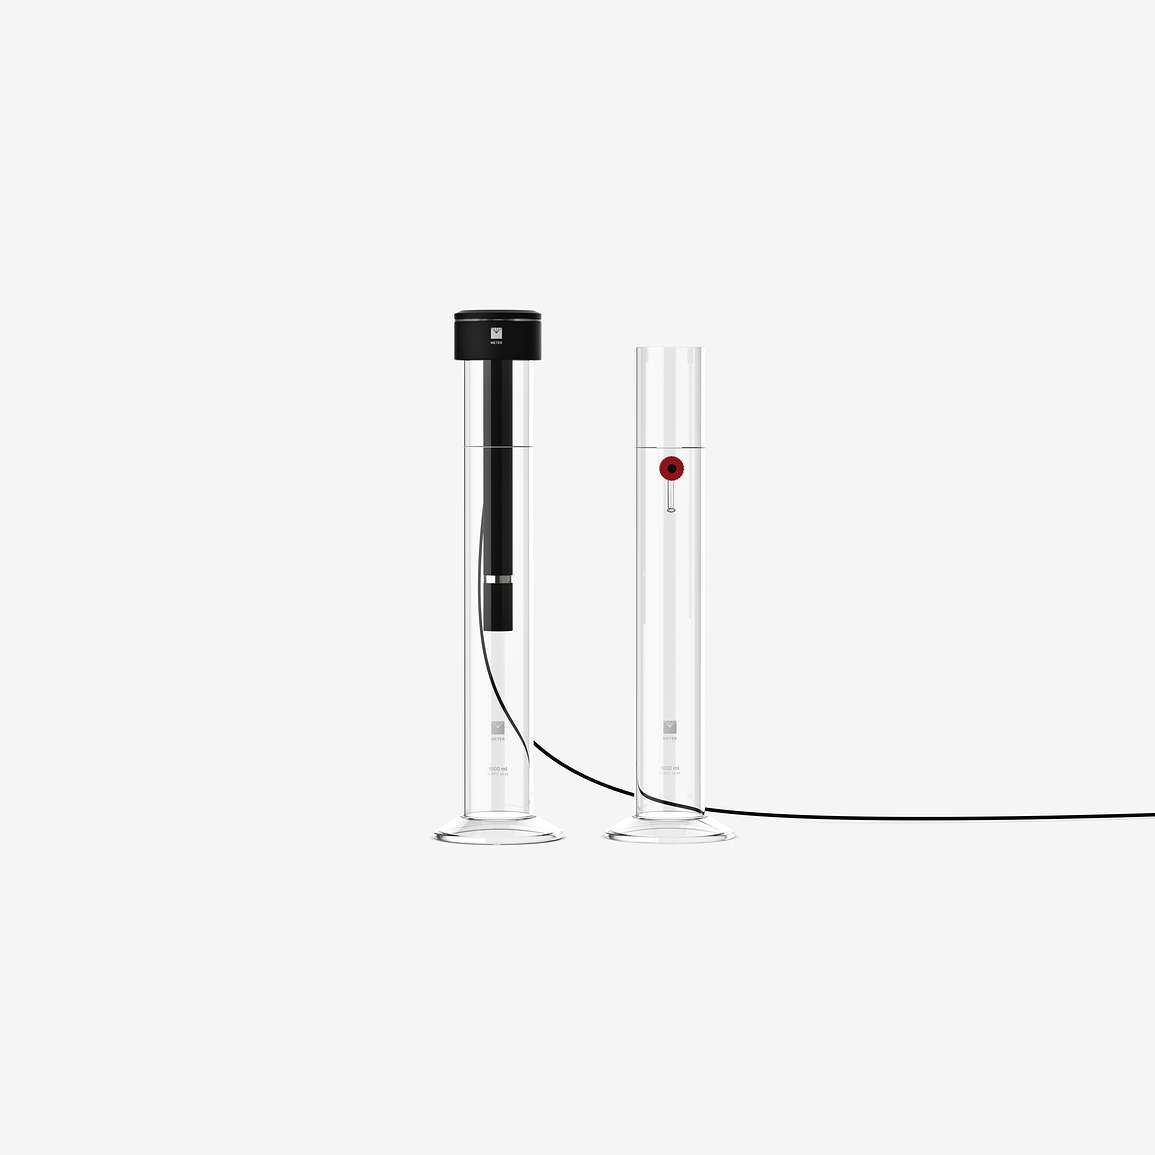
The two most commonly used methods for sedimentation measurements include the hydrometer and the pipette method. A third method, the integral suspension pressure, is an advancement of the sedimentation methods, based on what we’ve learned over time.There are some noticeable differences between the methods, as each one is measuring a specific zone within the cylinder. These differences are discussed below as we explore each method, their accuracy, and what is expected from that measurement.
What is the hydrometer method for grain size analysis?
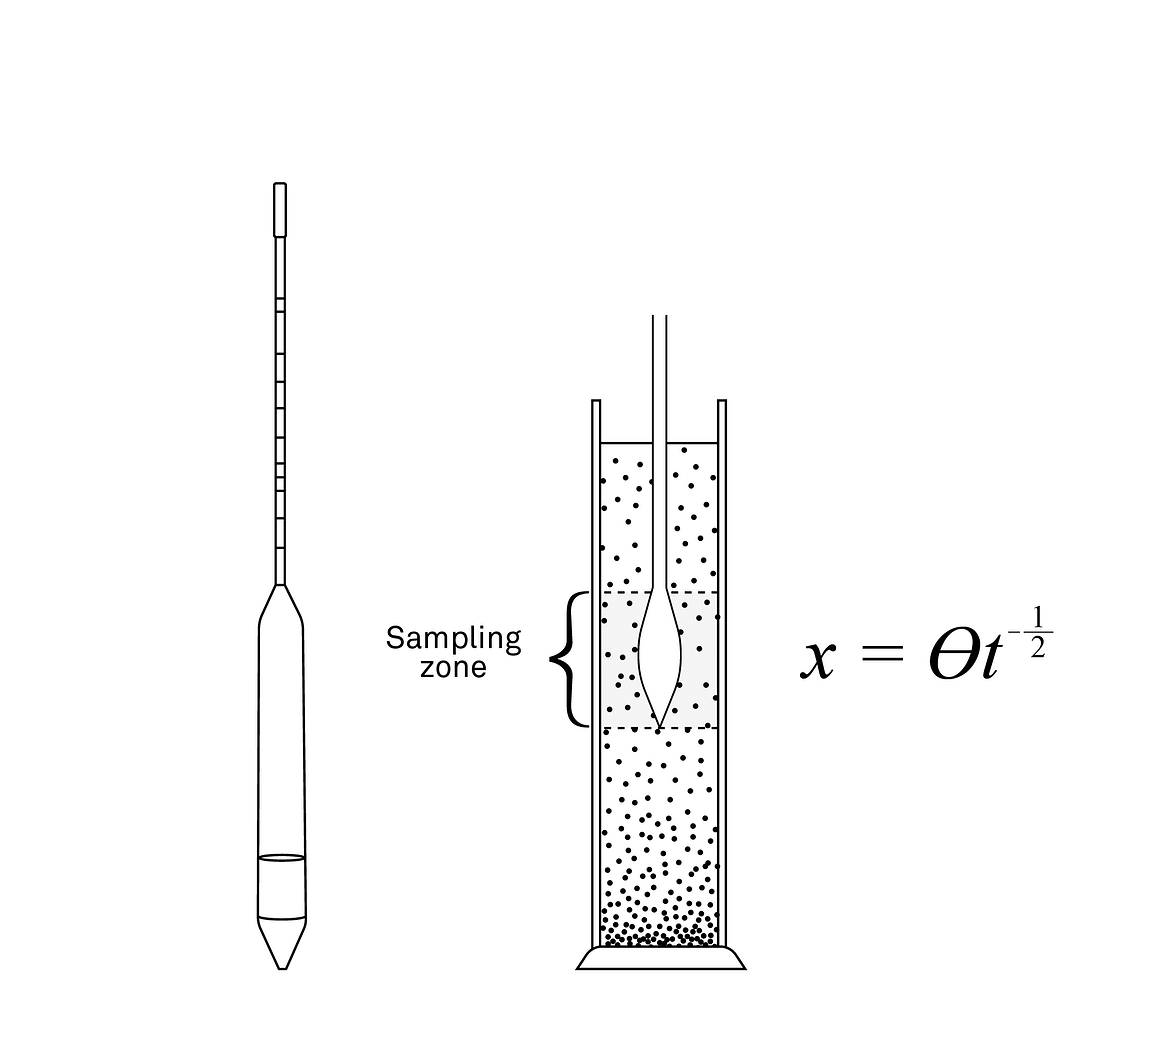
The hydrometer method is dependent on the fundamentals of Stokes law. An aqueous solution of soil is put into suspension, set aside, and allowed to settle over a given time period. Typically, the measurement takes 24 hours if trying to quantify two micron clay sizes. During this period, the hydrometer (Figure 9) is used to measure the change in density of the solution as the particles begin to settle. There’s a relationship between that change in density (or the settling depth of the hydrometer) and the various particle sizes that are still in suspension.
Figure 9. The hydrometer is inserted into the tube to measure the changes in the solution’s density.
In order to make an accurate measurement, the sand fraction needs to be separated and quantified beforehand using sieve analysis. This step is critical to get an accurate clay fraction estimation with the hydrometer method. Sand particles are so big, they settle too fast, making it difficult to get an accurate measurement. This is a common issue with almost all of the sedimentation-based methods.Lastly, this method does require a control ‘blank’ cylinder. In nearly all tests, sodium hexametaphosphate (a chemical dispersant) is added into the sedimentation cylinder and changes the density of the water. The blank cylinder acts like a control, correcting effects of temperature and dispersion due to the sodium hexametaphosphate.
Lastly, this method does require a control ‘blank’ cylinder. In nearly all tests, sodium hexametaphosphate (a chemical dispersant) is added into the sedimentation cylinder and changes the density of the water. The blank cylinder acts like a control, correcting effects of temperature and dispersion due to the sodium hexametaphosphate.
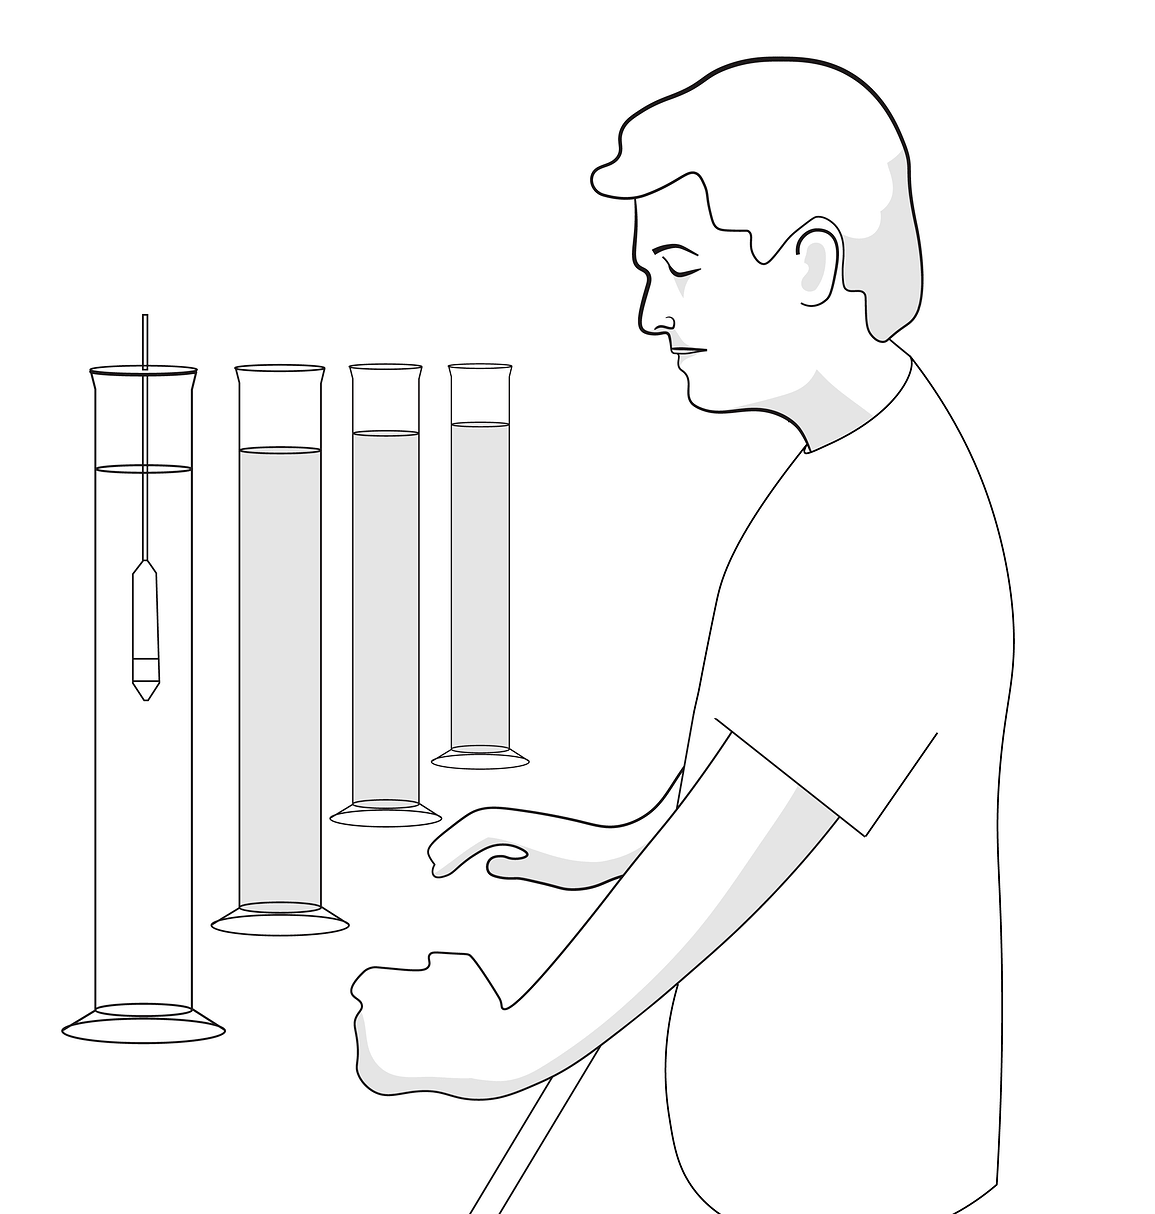
Figure 10. Watching for measurement readings using the hydrometer method is a manual, time-consuming process that can be prone to error.
Pros and cons of the hydrometer method for particle size analysis
Hydrometer method pros: Despite the challenges, the hydrometer approach is inexpensive, and the accuracy for this method is around +/- 3%.
Hydrometer method cons: As with most sedimentation methods, the hydrometer has its challenges. The hydrometer approach is a time-consuming endeavor and requires consistent attention at fixed time intervals, sometimes not at the best time of day or the middle of the night. Additionally, it is all performed manually, which can lead to error.
Challenge 1: The hydrometer method is a manual measurement. Manual measurements are always prone to errors because they rely on you making an accurate reading of the hydrometer, while keeping a careful eye on the cylinders for long periods.
Challenge 2: The disturbance of the sedimentation process caused when the hydrometer is inserted into the cylinders can be a source of error. A lot can go wrong with this approach, especially since this method requires fixed measurement times. To use this procedure correctly, measurements have to be taken at specific intervals depending on the points of your particle size distribution curve, whether it’s 30 seconds, one minute, four minutes, or 12-hour intervals.
Challenge 3: The dreaded 24-hour reading. Often you’ll start a measurement on Friday and have to come back on Saturday for the 24-hour measurement.
What is the pipette method for soil texture analysis?
In general, when referring to sedimentation methods for grain size analysis or soil texture analysis, the pipette method is the gold standard. It allows for a more accurate measurement, and depending on your approach, can account for the finer clays better than the hydrometer method.
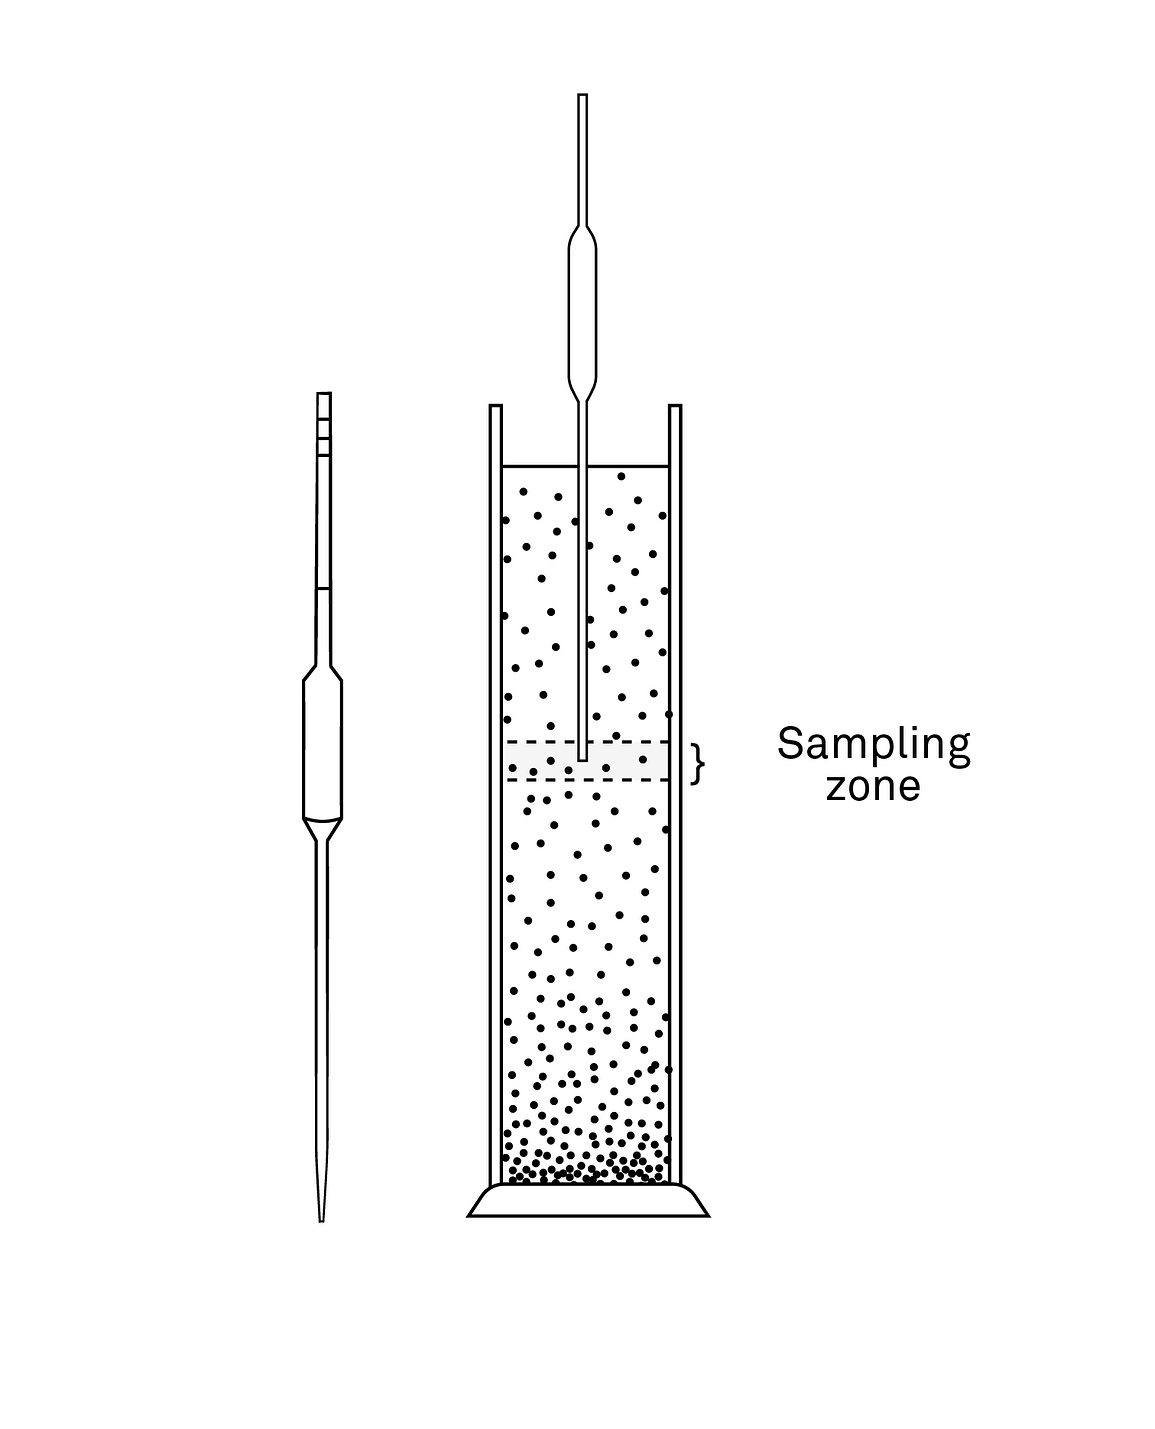
Similar to the hydrometer method, the sand fraction still needs to be separated beforehand and quantified separately with sieve analysis. However, different from the hydrometer, the pipette takes direct samples from a smaller sample zone. After samples are put in suspension using Stokes Law, small subsamples are taken at set intervals and dried in an oven. The dried samples are then weighed. Each weight represents the different particle sizes in the sample zone during that time. For example, one measurement could be in the two-micron size range, another measurement in the five-micron size range, and another measurement in the 20-micron size range.
Figure 11. Like the hydrometer method, a pipette (on the left) is inserted into the cylinder (on the right) for the measurement.
Pros and cons of the pipette method for grain size analysis
The pros of using the pipette method are:
The pipette method is often referred to as being a gold standard method due to its precision for estimating the clay fraction.
In contrast to the 24 hours time range for the hydrometer method, this method only takes 6 hours.
The challenges or cons of the pipette method are similar to the hydrometer method:
It’s a manual reading therefore prone to error.
There is potential for disturbance of the sedimentation process when inserting the pipette.
For accurate measuring of specific fractions, measurement times are also fixed.
And finally, despite the higher accuracy on the particle size distribution curve, its accuracy remains at +\- 3%.
What is the integral suspension pressure method (ISP method)?
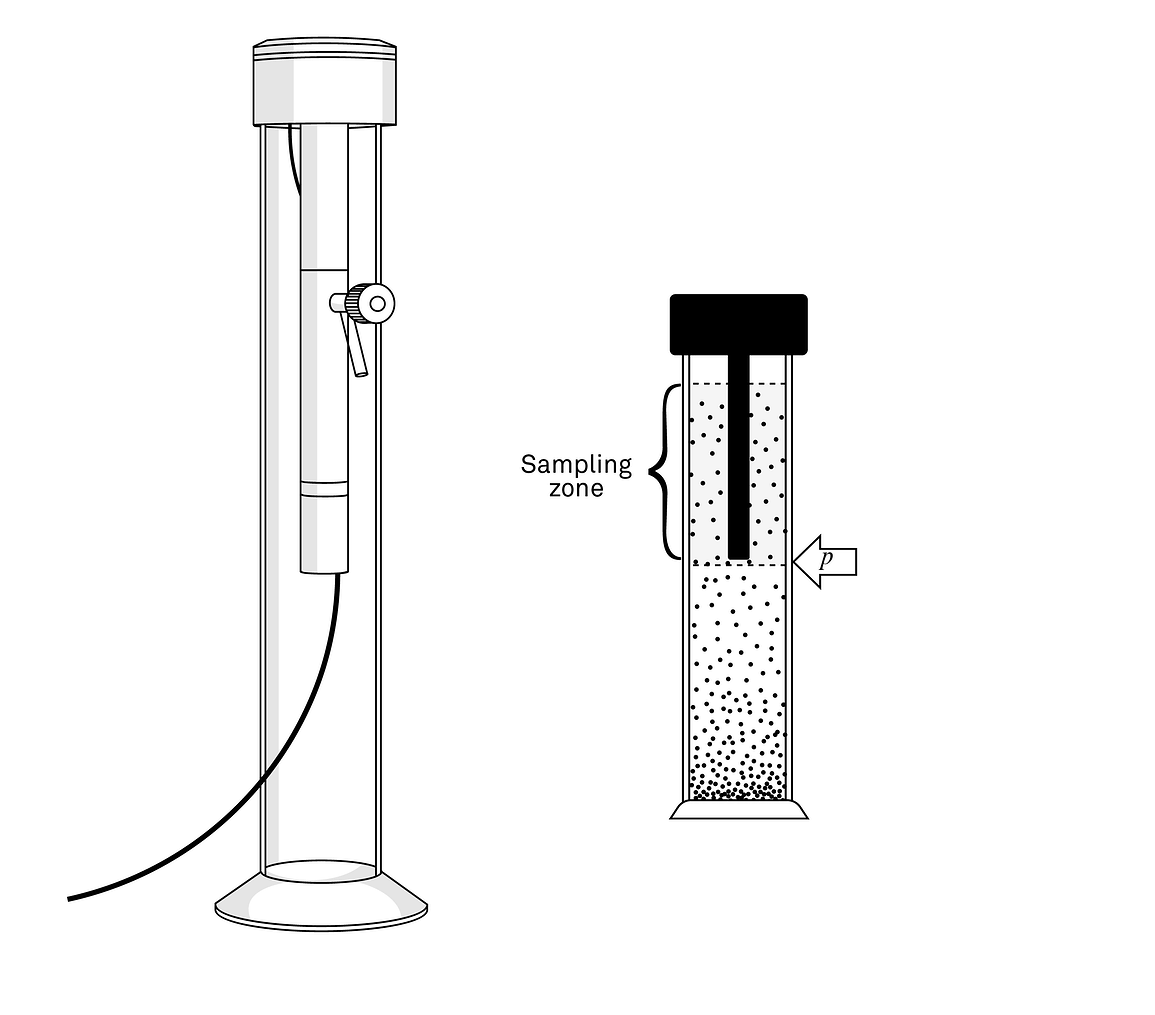
The integral suspension pressure or ISP method follows the same principles as the other sedimentation methods based on Stokes law. Unlike the traditional methods, the ISP method uses a high-precision pressure transducer to measure the density change in the solution as the particles are settling (Figure 12).
Figure 12. The integral suspension pressure or ISP method for grain size analysis.
How to get a complete, accurate grain size distribution curve
The integral suspension methods (the ISP method and the ISP+ method) automatically produce a complete grain size distribution curve. Figure 15 shows an example of what that curve might look like.
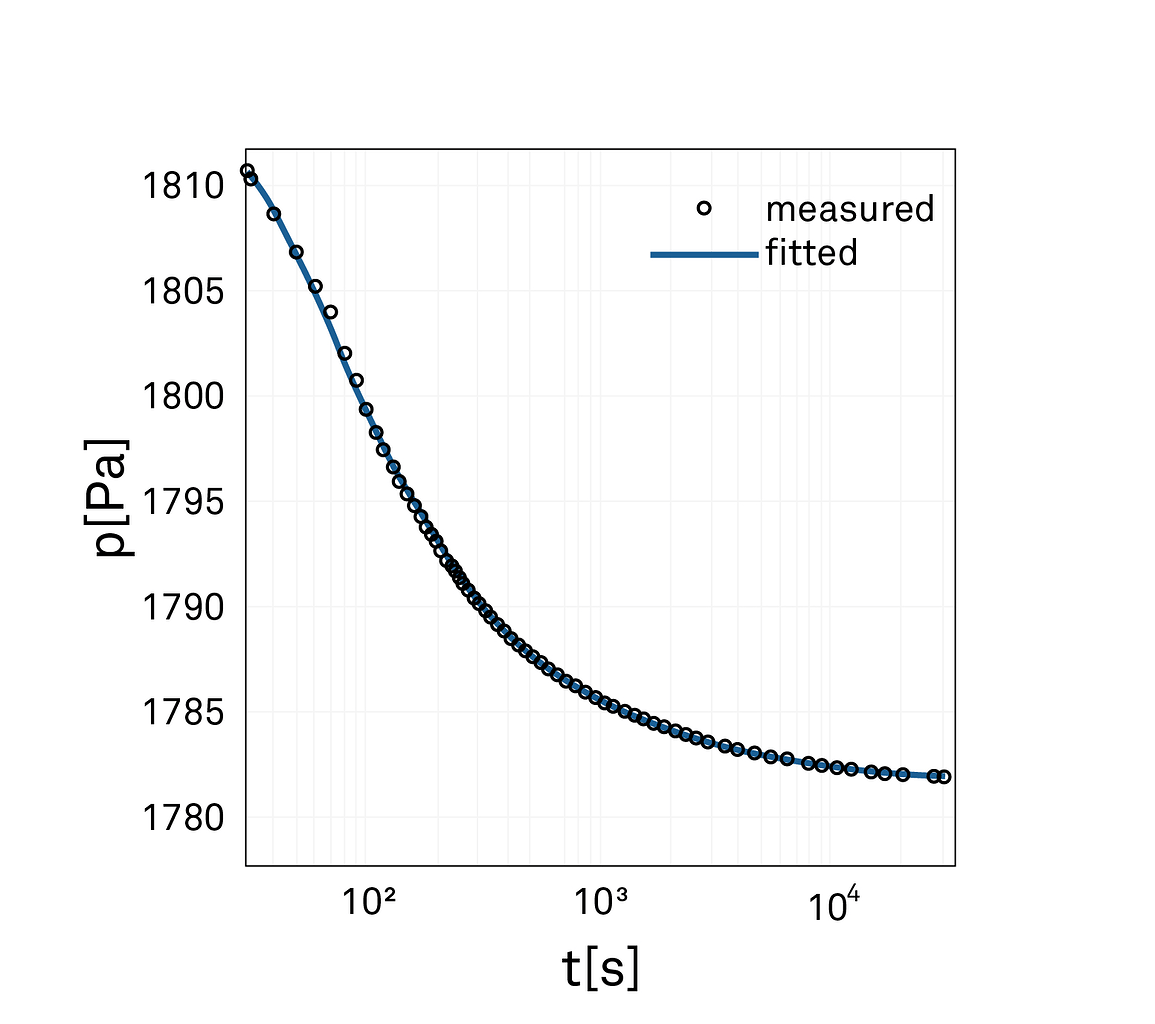
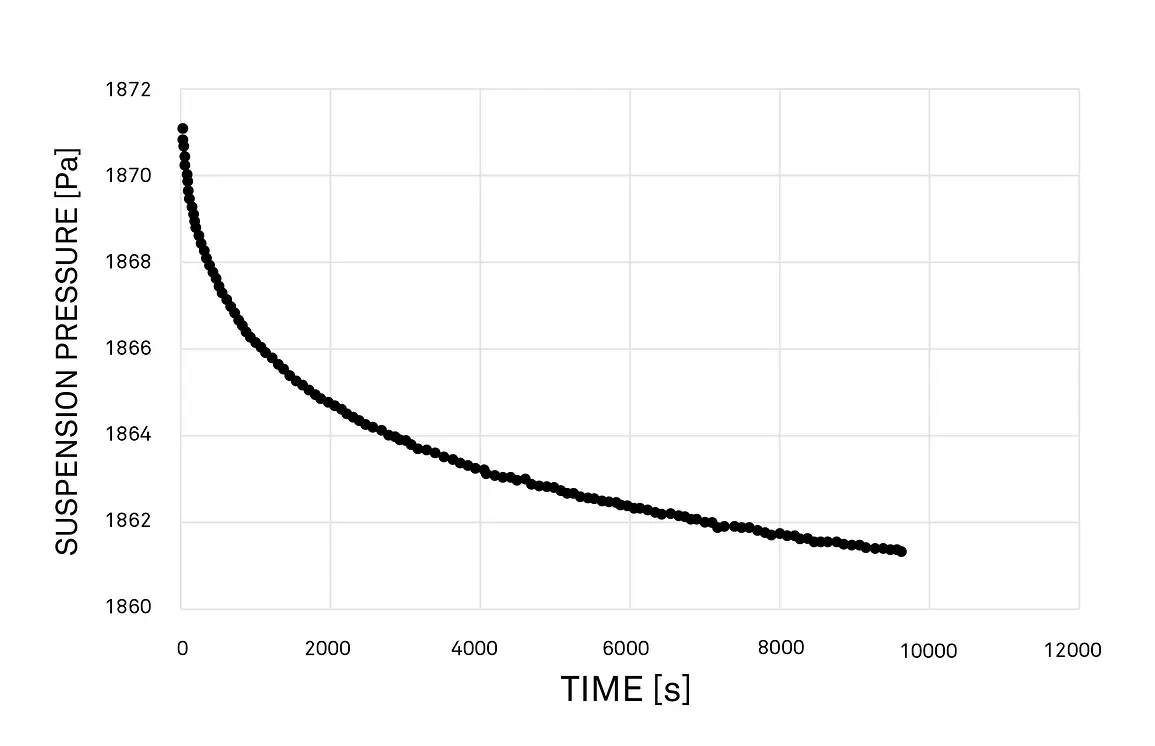
Figure 13. Graph showing actual pressure of measurement.
Figure 13 shows what the actual pressure measurement looks like. The scale of this graph is measured in Pascals of pressure, a very small scale (or low pressure measurement). It requires a precise and accurate pressure transducer to achieve this.
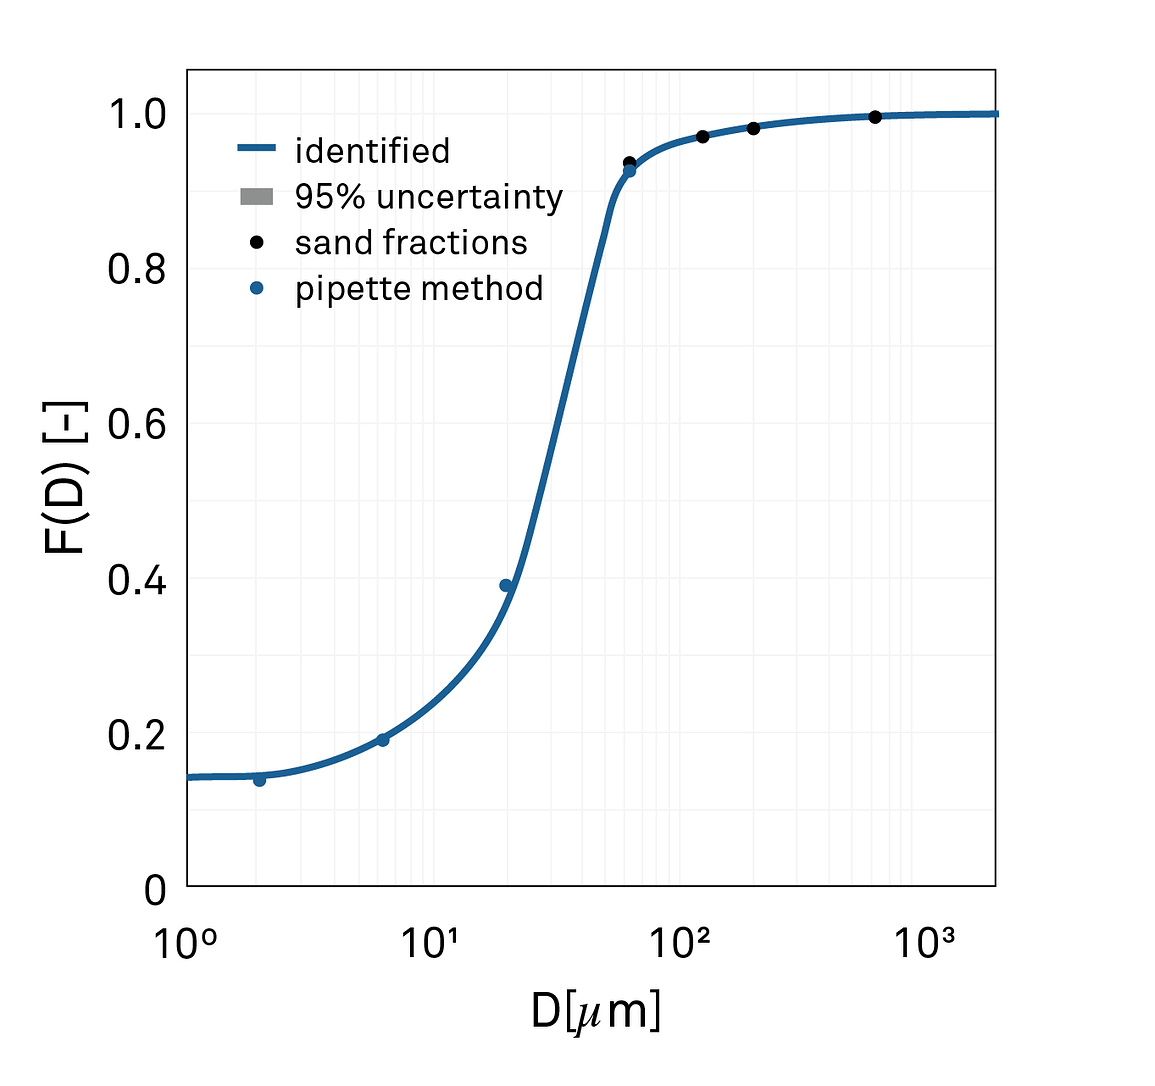
Figure 14. The resulting cumulative grain size distribution curve.
Figure 14 shows how that measurement generates a cumulative particle size distribution curve. This full process is described in a peer-reviewed paper about the integral suspension pressure method (ISP+) by Dr. Wolfgang Durner (Durner et. al, 2017).
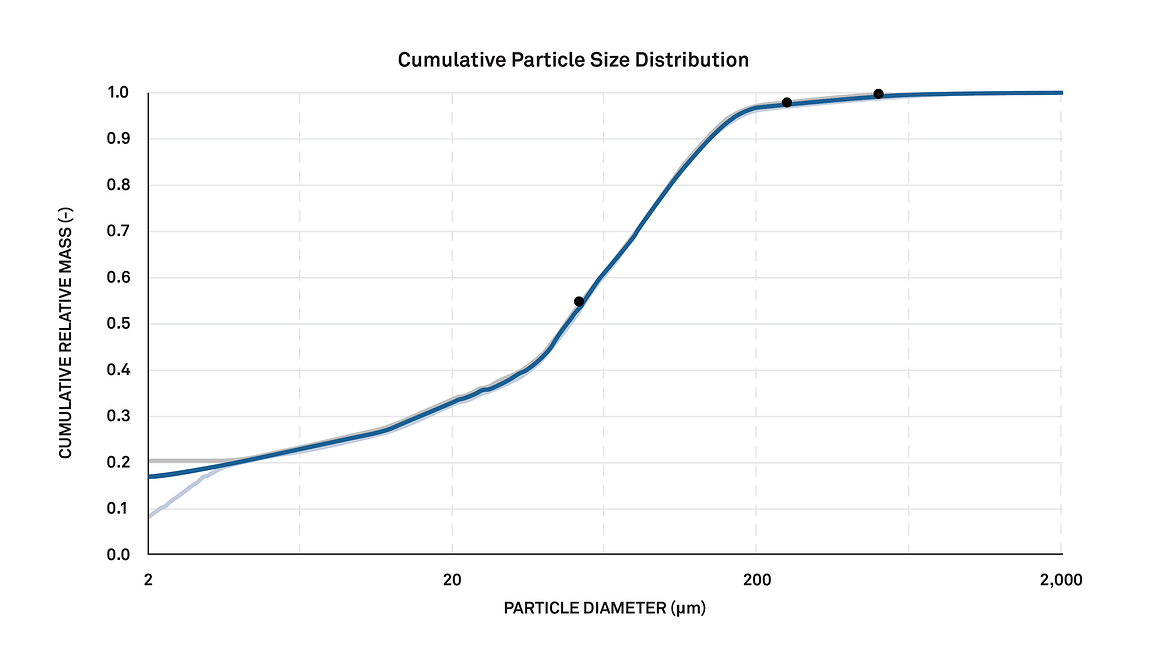
Figure 15. Complete cumulative grain size distribution graph generated using the ISP method.
Cons of the integral suspension method for grain size analysis
Cons: While there are clear advantages to the ISP approach (automated, detailed, and a complete particle size distribution curve), there are also significant challenges.
Despite cutting-edge pressure sensor technology with a resolution of 0.1 Pa, the accuracy of the ISP implemented is less than expected from numerical analysis. When looking at numerical analysis and synthetic measurement data, including the paper referenced above, the time required to determine the clay content exceeds the original expectations.
There may be inconsistencies caused by errors in the user-specified total dry soil mass or bias in early recorded pressure data caused by temperature effects on the measurement.
The device could have initial drift as it’s coming to equilibrium with the temperature if not thermally equilibrated with the suspension.
Film water on the cylinder that will slowly drain can impact the precise pressures causing the measurement to change.
The potential for error in the sand fraction estimation: This specific method is relying on estimated sand fractions. If there’s any error in the sand fraction estimation, that can propagate linearly down towards the finer fractions, like the clay fraction. An example of this: in a sandy soil with 50% sand and 5% clay, a relative error of 2.5% in the sand fraction will cause a relative error of 25% for the clay fraction, a significant error in a clay fraction estimation.
Why the ISP+ method for grain size analysis eliminates accuracy issues
Knowing about these problems, there was motivation to search for an improvement of the ISP methodology that was convenient and wouldn’t affect the overall practicality of the measurement. This led to the development of the ISP+ method, an extension of an experimental ISP protocol.
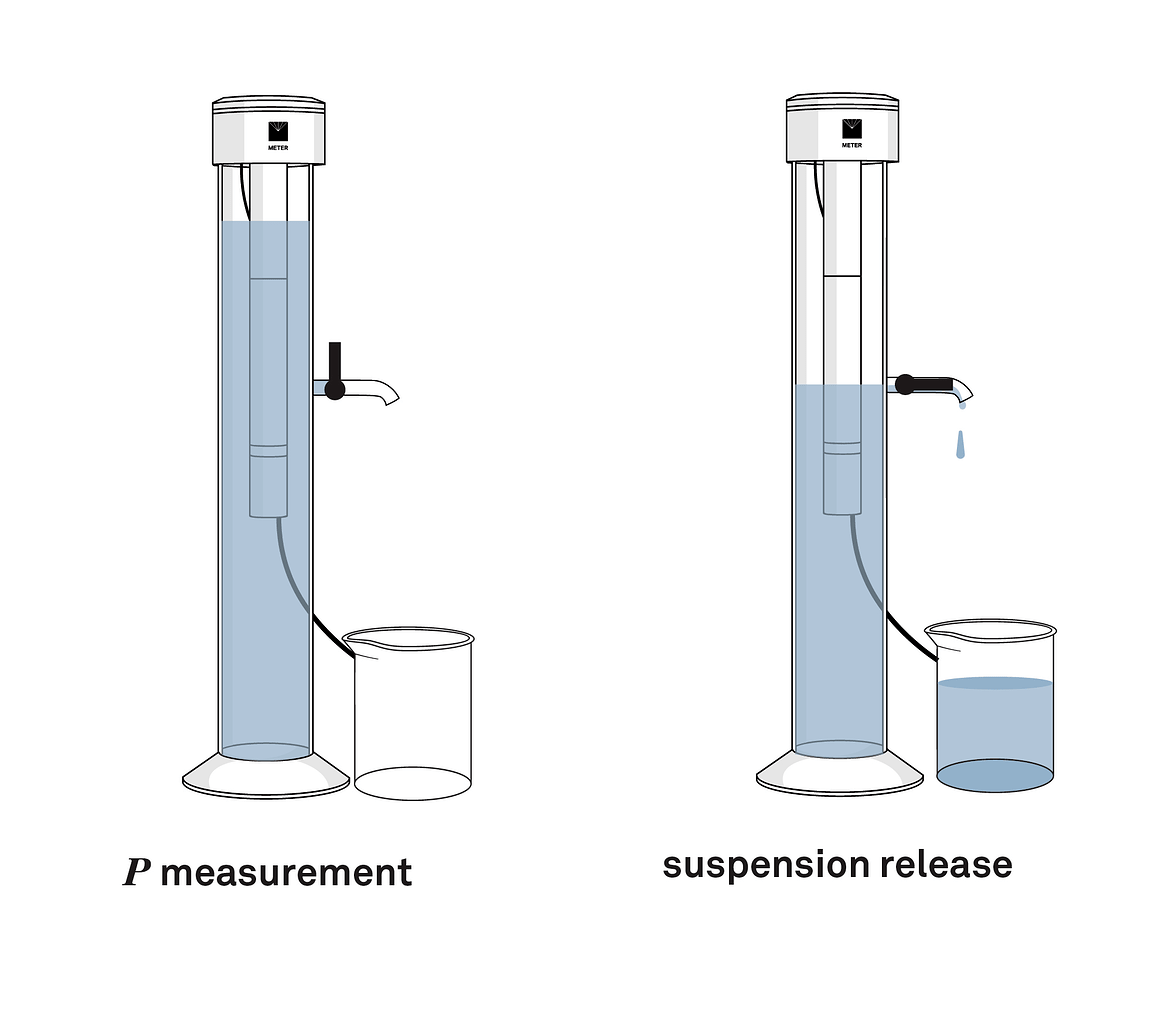
In the ISP+ method, after a certain amount of time, part of the suspension is drained from the sedimentation cylinder through an outlet on the side positioned at a specific depth. That suspension is collected in a beaker and then oven dried (see Figure 16). The drained solution is composed of all the finer particles remaining in suspension. Where the subsample is drained and at which time the solution is drained can change what particles are still in suspension. This, combined with the measurements from the pressure sensor, results in the sudden drop shown in the Figure 13 graph.
Figure 16. Sedimentation suspension is drained and dried in the oven to produce a grain size distribution curve in the ISP+ method.
An example of this would be taking a measurement after two hours then draining that solution from an outlet located at six centimeters. The maximum particle sizes at that depth are going to be 2.8 microns. We can then use that to quantify what’s left in the remaining solution and tighten our window for analysis. The result is that the ISP+ method is constrained from two sides. The sand range is constrained by the external sieve data and the clay range is constrained by the drainage. It tightens the calculation on the clay fraction, making the ISP+ method a more robust, accurate, and reliable method
Figure 17. The graph shows the pressure change during the draining procedure in the ISP+ method.
Other advantages of the ISP+ method
Another key advantage of the ISP+ method is the decrease in measurement time from 8 to 12 hours down to just 2.5 hours. And, ISP+ not only provides a significant improvement in measurement time (due to automation), it also provides a big improvement in the overall accuracy of the measurement. The accuracy increases from +\- 3% (ISP, pipette and hydrometer method) to an accuracy of +\- 0.5%.
The PARIO (Figure 18), made by METER, is an example of a grain size analysis instrument that automates the ISP+ method to determine soil texture.
Figure 18. PARIO automates the ISP+ method for faster, more accurate soil grain size analysis.
What are optical methods for soil grain size analysis?
The most common optical methods used today are X-ray attenuation, laser light scattering from diffraction measurement, and VisNIR infrared spectroscopy. VisNIR spectroscopy is a promising method that can accurately quantify soil particle size, especially looking at things like clay fraction. However, we’ll primarily focus on laser light scattering as it’s the most common method used.
The laser diffraction method is based on the principle that particles of a given size diffract light at a certain angle. As particle size decreases, the angle of light diffraction will increase. This means smaller particles like clay will diffract light at a larger angle than those larger particles such as sands or silts.
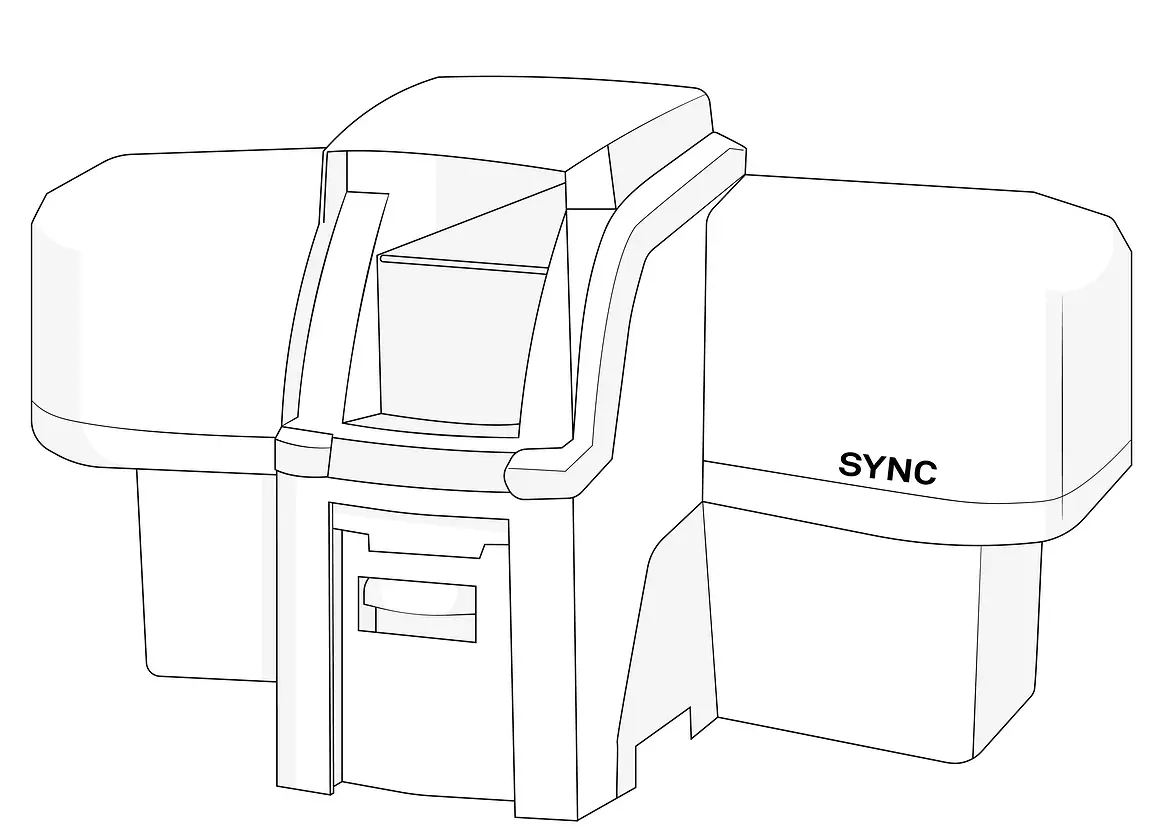
Figure 19. Laser soil particle size analyzer.
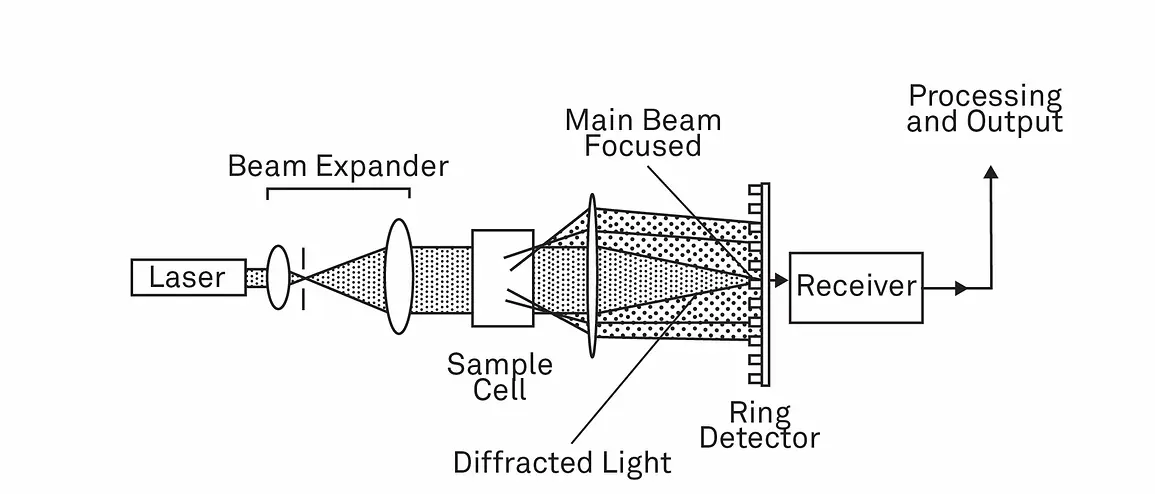
The schematic in Figure 20 depicts a design for a laser particle size analyzer. A parallel beam of monochromatic light shines from the device, passing through a similar sample suspension as all the other methods. The diffracted light is then focused to a photosensitive ring detector. The intensity measured at the detector is a function of the angle used to estimate the particle size distribution. This is based on what is known as MIE theory (Gee et al 2002).
The measurement range for laser diffraction methods are from 0.04 to 2000 microns. It does depend on the device and the limited measurement volume as the laser beam only has a width of 10 to 25 millimeters.
Figure 20. Basic schematic for a laser particle size analyzer (“Showing the primary components; light sources, sample, focusing lens, detector, and processing system” (Syvitski, 1991).
Pros and cons of the laser diffraction method for soil particle size analysis
Cons: As with other methods, there are challenges with laser diffraction.
The strong dependence on particle shape and orientation: Several authors have argued that the laser diffraction method underestimates the amount of clay particles by 20 to 70% relative to the pipette method. This could be due to the orientation of the clay particles.
Many clay particles are flat. Its orientation will appear bigger than what its actual size is to a laser diffractometer and cause inaccuracies from impacted measurements.
Another issue with these devices is they are expensive and can cost upwards of $50-60,000, if not more. The high cost of the instrumentation along with uncertainties and correction factors make these methods less attractive.
Pros: With that, there is one advantage of the laser diffractometer, or the laser diffraction method: more samples can be run at a given time, and you can obtain measurements more quickly. In addition, measurements don’t take hours to be completed. So, if you need high throughput for your measurements, this approach might be a good method to use, depending on the relative accuracy required.
Which soil grain size analysis method should you choose?
It depends. You’ll need to examine your research goals, define what the measurement will be used for, and then weigh the advantages and disadvantages of the above methods. Keep in mind that the accuracy of soil texture analysis and the grain size distribution curve depends on the methods and tools you use.
For example: The PARIO (ISP+ method) is a good method for people looking to minimize the amount of time and labor it takes to perform a particle size analysis because it reduces labor while improving the accuracy over other sedimentation-based methods.
It’s important to understand that no matter what method you choose, you will need to pretreat the samples and sieve the sand fraction. In short, understanding the pros and cons of each method and defining the desired outcome can help you decide which will be most effective.
References
Dane, Jacob H., and Clarke G. Topp, eds. Methods of soil analysis, Part 4: Physical methods. Vol. 20. John Wiley & Sons, 2020. Article link.
Durner, Wolfgang, Sascha C. Iden, and Georg von Unold. “The integral suspension pressure method (ISP) for precise particle‐size analysis by gravitational sedimentation.” Water Resources Research 53, no. 1 (2017): 33-48. Article link.
Gee, G.W. and Or, D. (2002). 2.4 Particle Size Analysis. In Methods of Soil Analysis (eds J.H. Dane and G. Clarke Topp). Article link.
McKeague, J. A., and Peter C. Stobbe. “History of soil survey in Canada 1914-1975.” (1978). Article link.
Syvitski, James PM, ed. Principles, methods, and application of particle size analysis. Vol. 388. Cambridge: Cambridge University Press, 1991. Book link.
Yong, Raymond Nen, and Benno P. Warkentin. Introduction to soil behavior. No. 451 pp. 1966. Article link.
some. Thanks so much!
Questions?
Our scientists have decades of experience helping researchers and growers measure the soil-plant-atmosphere continuum.
Among the thousands of peer-reviewed publications using METER soil sensors, no type emerges as the favorite. Thus sensor choice should be based on your needs and application. Use these considerations to help identify the perfect sensor for your research.
TEROS sensors are more durable, accurate, easier and faster to install, more consistent, and linked to a powerful, intuitive near-real-time data logging and visualization system.