Sensor and device maintenance: Winter checklist
Stay on top of routine maintenance tasks this winter to prevent damage form harsh conditions

Every researcher’s goal is to obtain usable field data for the entire duration of a study. A good data set is one a scientist can use to draw conclusions or learn something about the behavior of environmental factors in a particular application. However, as many researchers have painfully discovered, getting good data is not as simple as installing sensors, leaving them in the field, and returning to find an accurate record. Those who don’t plan ahead, check the data often, and troubleshoot regularly often come back to find unpleasant surprises such as unplugged data logger cables, sensor cables damaged by rodents, or worse: that they don’t have enough data to interpret their results. Fortunately, most data collection mishaps are avoidable with quality equipment, some careful forethought, and a small amount of preparation.
Below are some common mistakes people make when designing a study that cost them time and money and may prevent their data from being usable.
In the following webinar, METER research scientist Dr. Colin Campbell discusses:
When designing a study, use the following best practices to simplify data collection and avoid oversights that keep data from being usable and ultimately, publishable.
Setting up sensors in the lab before going to the field helps a researcher understand how their sensors work. For instance, scientists can take soil sensor readings in different soil types, which will give them a solid understanding of what soil moisture values to expect in different scenarios. Figuring out the sensors before going to the field helps researchers understand correct installation, how long an installation might take, and it allows them to diagnose problems, such as a sensor that might be reading incorrectly. During this time, they can work out what tools and equipment they might need for the installation. Having a dedicated installation toolbox filled with important tools such as zip ties, pliers, markers, flashlights, and batteries can save hours of trips back and forth to the site.
Researchers should make a site plan with a map and remember that an installation usually takes twice as long as they think it will. Having a site plan significantly reduces human error, especially when pressed for time. When arriving at the research site, scientists can install according to the plan and record adjustments to the map as they go. This step saves significant time in the future if they, or other colleagues, have to find and dig up a problematic sensor. Having a backup plan for things that might go wrong is also important. For instance, what if a soil is too rocky at a certain depth? Or what will happen if a weather station or humidity sensor can’t be installed at two meters? Researchers need to think about what to do if their original plan is not going to work because often, they won’t be able to return to the site for weeks or months.
Before selecting a site, scientists should clearly define their goals for gathering data. They need to know what they’re going to do with the data, so the data can answer the correct questions. Once goals are understood, then a researcher can begin to understand where to put their sensors.
The most influential issue a researcher will face in determining where to put their sensors is variability. For instance, scientists studying the soil will need to understand variability factors such as slope, aspect, vegetation type, depth, soil type, and soil density. If they are studying a canopy, they will need to understand the heterogeneity of the plant cover and deploy accordingly. If a researcher is comparing data, he/she will need to be consistent with sensor placement. This means that above-ground heights or below-ground depths should be consistent site-to-site. There’s no way to monitor every source of variability, so researchers should monitor the sources that are the most important. For a more in-depth look at variability, read “Soil moisture sensors: How many do you need?”
Site selection should also be practical. Researchers will need to look at the data as often as possible (we recommend at least once a month) to be sure everything is working correctly, thus the data logger needs to be accessible. Cellular data loggers make accessing data much easier, especially at remote sites. Uploading data to the cloud means scientists can access, share, and troubleshoot data every day from the comfort of their office.
Also, when choosing a data logger location, try to avoid long wire runs which can cause voltage potential gradients if lightning strikes. Choose a location where the sensors will be easy to plug in, and zip tie extra cable to the post for strain relief so the cables won’t get pulled out of the logger. Unplugged sensors or broken connections can be catastrophic to a study.
The more metadata researchers record at a research site, the better they will understand their data, and the more time they will save in the long run. Some data loggers such as the ZL6 automatically record important metadata, such as GPS location, barometric pressure, and sensor serial number. In addition, ancillary measurements such as soil temperature or microclimate monitoring, can be another source of metadata. An all-in-one weather station such as the ATMOS 41 automatically records weather events and can be an important way to benchmark or ground truth soil moisture, water potential, or other data.
To document site information not automatically recorded by field instrumentation, many scientists find it practical to create a shared site-characterization worksheet that they can use to inform additional colleagues working at the site. Metadata that will be critical to future data insight and publication are: soil type, soil density, types of cover, measurement interval, raw data and type of calibration used, notes about an irrigation system (if present), which soil moisture sensors are installed at which depth, notes on why the site was picked, events that might affect your data gathering such as a harvest, or any other information which may be hard to recall when analyzing the data. This information will be important when it’s time to publish, and putting it in a shared, cloud-based location will save headaches.
If a scientist wants accurate data, correct sensor installation should be his/her number one priority. For example, when measuring in soil, natural variations in density may result in accuracy loss of 2 to 3%, but poor installation can potentially cause accuracy loss of greater than 10%. It doesn’t take much extra time to install sensors correctly, so researchers should read instructions carefully (for more in-depth information, read “How to install soil moisture sensors: faster, better, and for higher accuracy”). If installing soil moisture sensors, use the TEROS borehole installation tool for higher accuracy.
After sensor installation but before closing the auger hole or trench, be sure to check the sensors with a ZSC, our Bluetooth instantaneous reading device, to make sure the reading is accurate. It will be painful to dig up a sensor later after collecting a season’s worth of bad data.
In addition, make sure to label each sensor with the sensor type, installation depth, and other information that might be important. Researchers who install hundreds of sensors sometimes purchase an electronic labeling device to barcode the sensors, but tape and a permanent marker also work. Tuck the labels inside the data logger for protection from the weather.
Protecting sensors at all costs is critical to a study. It’s important for researchers to run exposed sensor cables inside PVC pipe or flexible electrical conduit and run it up the data logger post for approximately 60 cm (2 ft.). This will prevent damage by rodents or shovels. Also, tie cables neatly to the post with UV-resistant zip ties, so they are tightly held but not pulling against the data logger (make sure there is some strain relief). During site visits, it’s also a good idea to inspect the seals on the data logger to check for cracking. If there is cracking on the data logger seal, it may not be weatherproof and should be replaced. Contact customer support for a free replacement.
In addition, researchers should check actual data as often as possible to troubleshoot issues. One scientist discovered an error in his pyranometer data by comparing it to a quantum sensor at the same height. Only by looking at actual values did he discover that a bird had soiled his solar radiation sensor, rendering it useless for a major portion of his study. He ended up having to calculate the data from the quantum sensor which was not as accurate. Regular checking of the data will prevent problems that can be detrimental to a research project. The new ZENTRA Cloud and ZL6 allow researchers to troubleshoot and graph data as often as every day. Only two to three minutes spent spotting trends or discovering errors may save weeks of lost data.
The ZL6, like its predecessors, averages data. So if researchers don’t want an average, they should record data more frequently. However, generating large amounts of data will not necessarily further the goal. What’s important is capturing and understanding the time series that pertains to the research hypothesis. If a researcher is trying to understand the yearly trends in soil moisture, and he/she is taking five-minute data, it’s going to generate reams of data that won’t be useful because soil moisture doesn’t change much on a minute basis. Then the researcher is forced into post-processing to thin the data. Still, if the goal of the study is to know the instant water starts infiltrating the soil, capturing data at one-minute intervals or less is critical. These researchers will need a Campbell Scientific data logger, or one able to trigger a reading event based on instant change. However, most people overestimate how much data they need. When measuring solar radiation, every 15 minutes is most likely sufficient. For evapotranspiration, it’s common to record half-hourly data. In these and many other cases, short recording intervals like every five minutes is probably much too frequent.
Another important step researchers often forget is to match all of the data logger time-measurement frequencies. If a researcher has two data loggers reading every 15 minutes, and someone else sets up a logger to read every hour, then only the hourly data can be used.
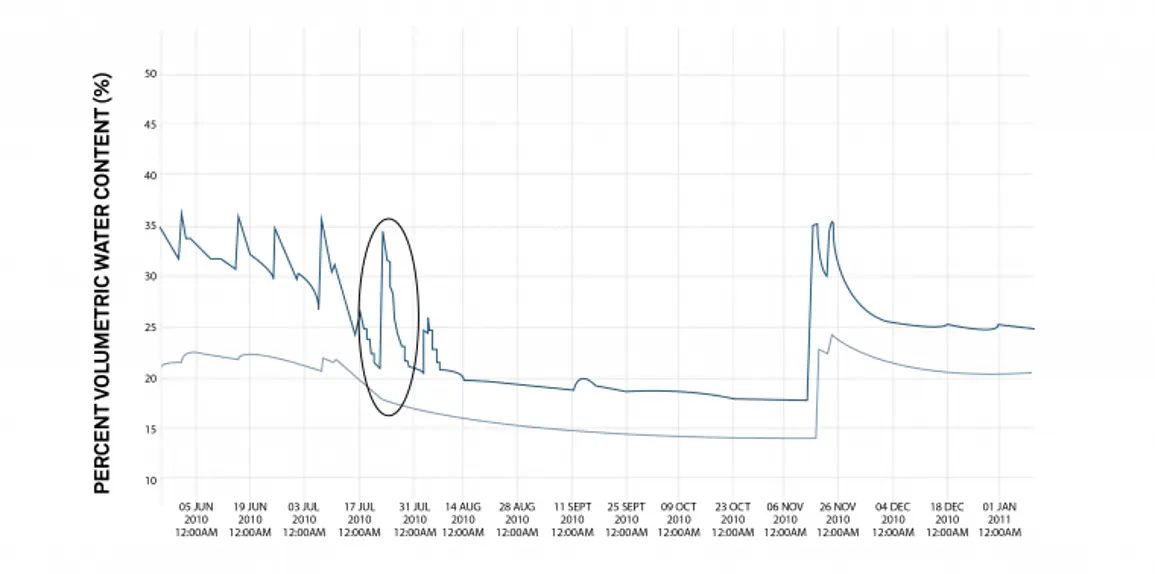
If a scientist discovers an error in the data, it’s not necessarily because the sensor is broken. Often, interesting sensor readings tell a story about what is happening in the soil or the environment. Data interpretation can sometimes be difficult, and researchers may need to go back to the site to understand what is really happening. For example: in Figure 1, it looks like a soil moisture sensor may be broken, however, when the scientist investigated more closely, he discovered that the evapotranspiration was higher than the infiltration.
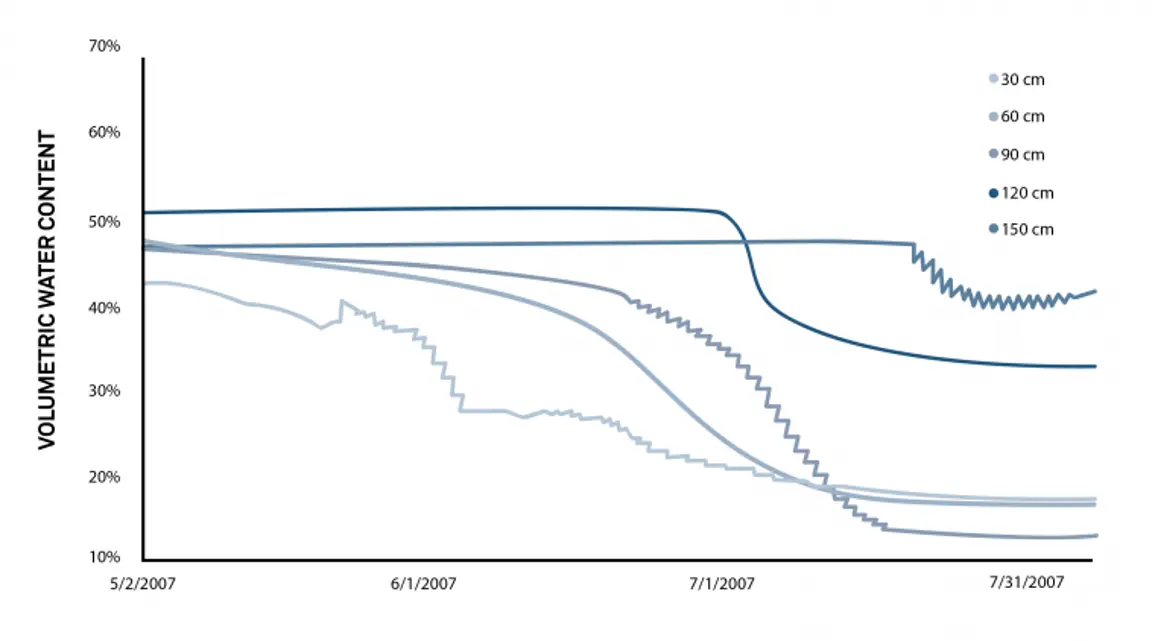
In addition, researchers may need to think outside the box to interpret their data. They can try looking at the data in a few different ways. Figure 2 illustrates the traditional temporal way to graph data. In Figure 3, the same data can be viewed in a completely different way.
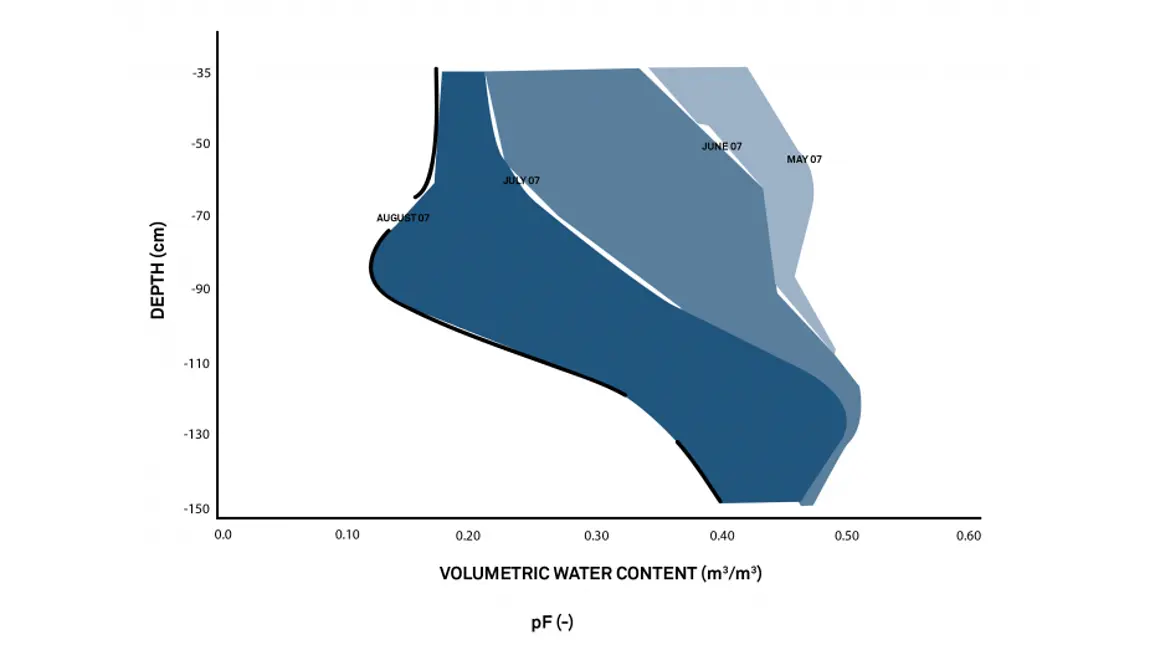
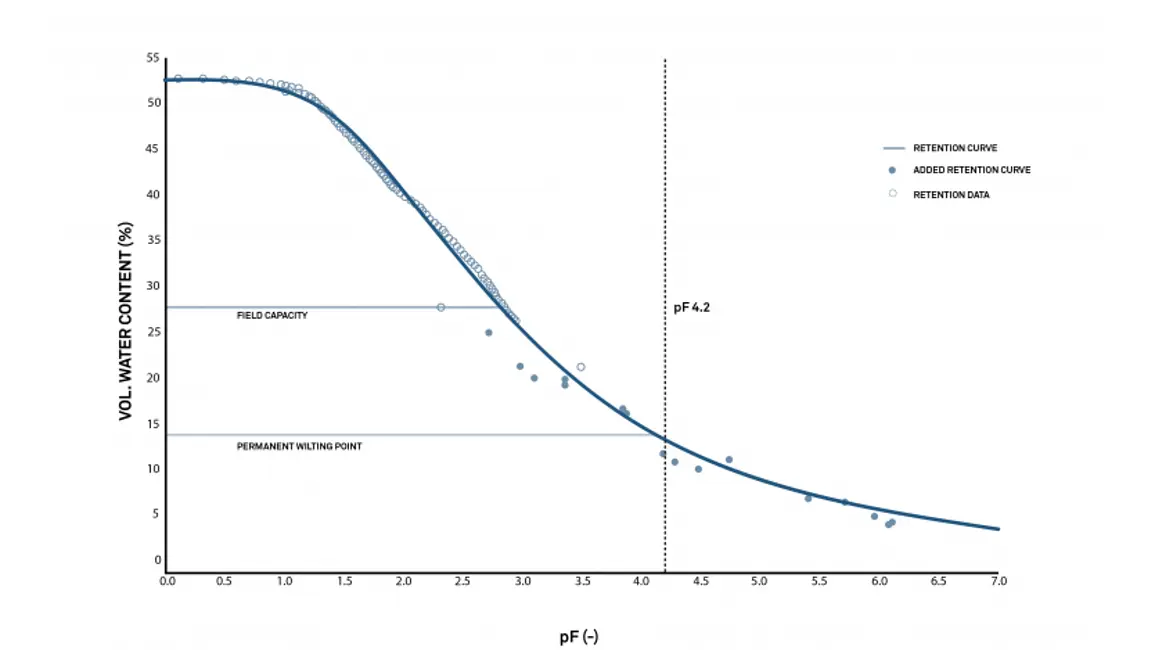
Researchers could also convert their water content data to water potential using a moisture release curve (see Figure 4).
Once the water potential data is obtained, the data would look like this:
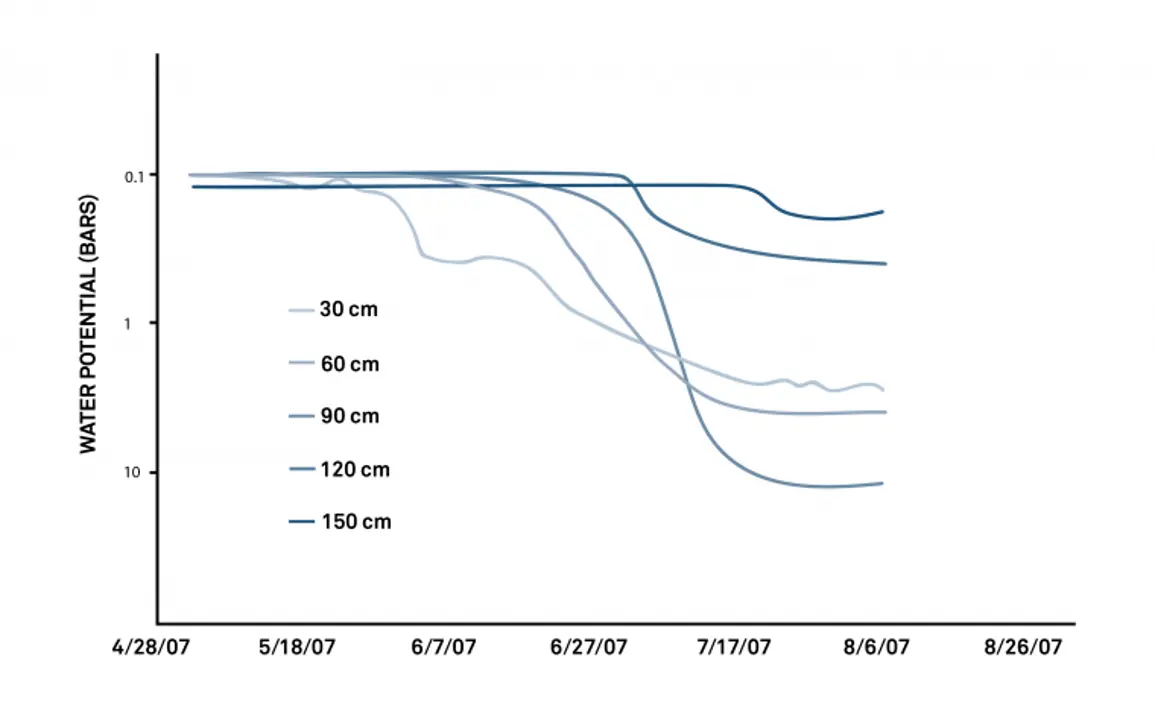
Plotting the same data three different ways could illuminate issues or problems a researcher might not notice with a traditional temporal graph.
Spending a small amount of extra time to get things right over the course of an experiment pays big dividends in saved time, effort, and money. Preparation, planning, a clearly defined research goal, proper site selection, installation, maintenance, timing, and correct data interpretation all go a long way toward preventing typical data mishaps that can compromise a research project. The end result? Data that can be published or used to make decisions.
In the video below, Dr. Colin Campbell discusses how ZENTRA Cloud simplifies the data collection process and why researchers can’t afford to live without it. He then gives a live tour of ZENTRA Cloud features.
Want to see how ZENTRA Cloud revolutionizes data collection and management for hundreds of researchers? Get a live tour or take a virtual tour.
Learn everything you need to know about measuring soil moisture—all in one place: why you need it, how to measure it, method/sensor comparisons, how many measurements, where you should measure, best practices, data troubleshooting, and more.
Download the researcher’s complete guide to soil moisture
Our scientists have decades of experience helping researchers and growers measure the soil-plant-atmosphere continuum.
Stay on top of routine maintenance tasks this winter to prevent damage form harsh conditions
If you want accurate data, correct sensor installation should be your top priority. Poor installation can potentially cause accuracy loss of greater than 10%.
Site disturbance matters—and there are ways to reduce its impact on soil moisture data. Find out what installation techniques and best practices can set you up for success.