Irrigation scheduling: Solve the mystery of when to water
Water potential is a better indicator of plant available water than water content, but in most situations it’s useful to combine the data from both sensors.

As a plant researcher, you need to effectively assess crop performance, whether you’re selecting the best variety, trying to understand abiotic stress tolerance, studying disease resistance, or determining climate resilience. But if you’re only measuring weather data, you might be missing key performance indicators. In this article and in the video below, we discuss an important but often overlooked indicator: soil water potential (soil suction). Water potential is underutilized by plant researchers in abiotic stress studies even though it is the only way to assess true drought conditions when determining drought tolerance in plants. Learn what water potential is and how it can improve the quality of your plant study.
If you’ve studied plant populations, you’re probably familiar with the simplified equation in Figure 1 that represents how we think about the impact of genetics and the environment on observable phenotypes.
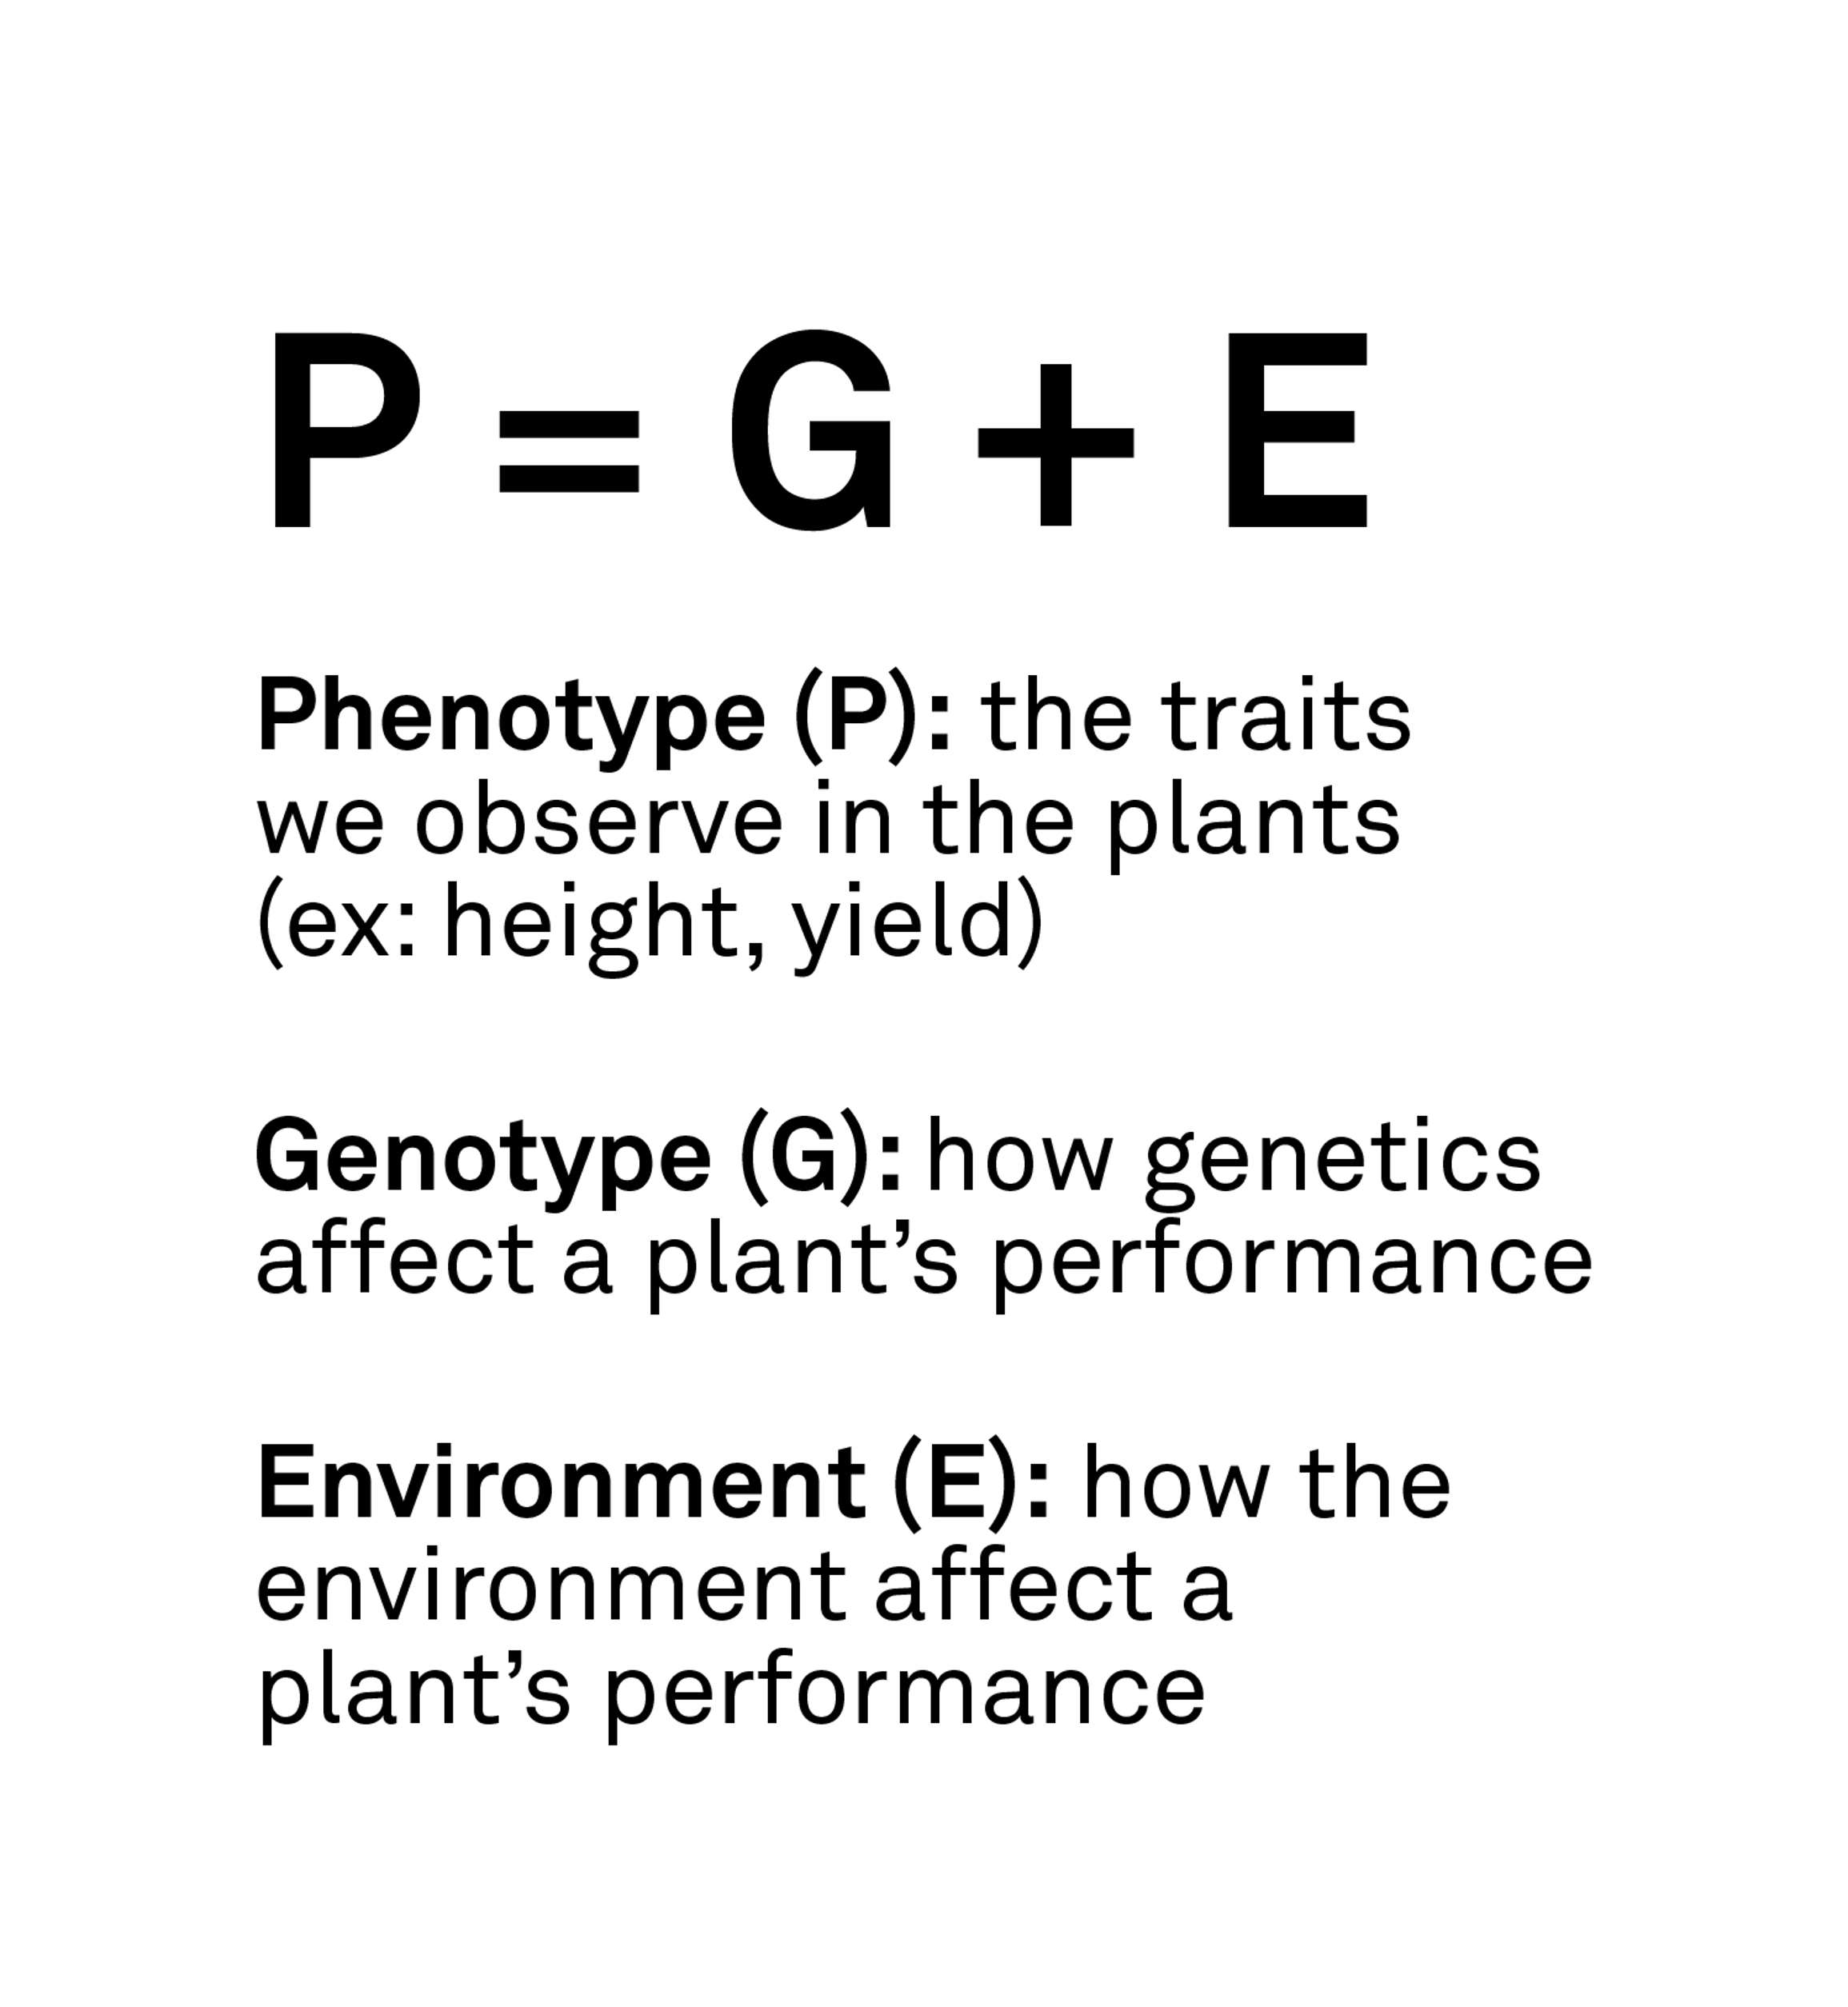
This equation breaks down the observed phenotype (plant height, yield, kernel color, etc.) into the effects from the genotype (the plants underlying genetics) and the effects of the environment (rainfall, average daily temperature, etc.). You can see from this equation that the quality of your study directly depends on the kind of environmental data you collect. Thus, if you’re not measuring the right type of data, the accuracy of your entire study can be compromised.
Drought studies are notoriously difficult to replicate, quantify, or even design. That’s because there is nothing predictable about drought timing, intensity, or duration, and it’s difficult to make comparisons across sites with different soil types. We also know that looking at precipitation alone, or even volumetric water content, doesn’t adequately describe the drought conditions that are occurring in the soil. Soil water potential is an essential tool for quantifying drought stress in plant research because it allows you to make quantitative assessments about drought and provides an easy way to compare those results across field sites and over time. Let’s take a closer look to see why.
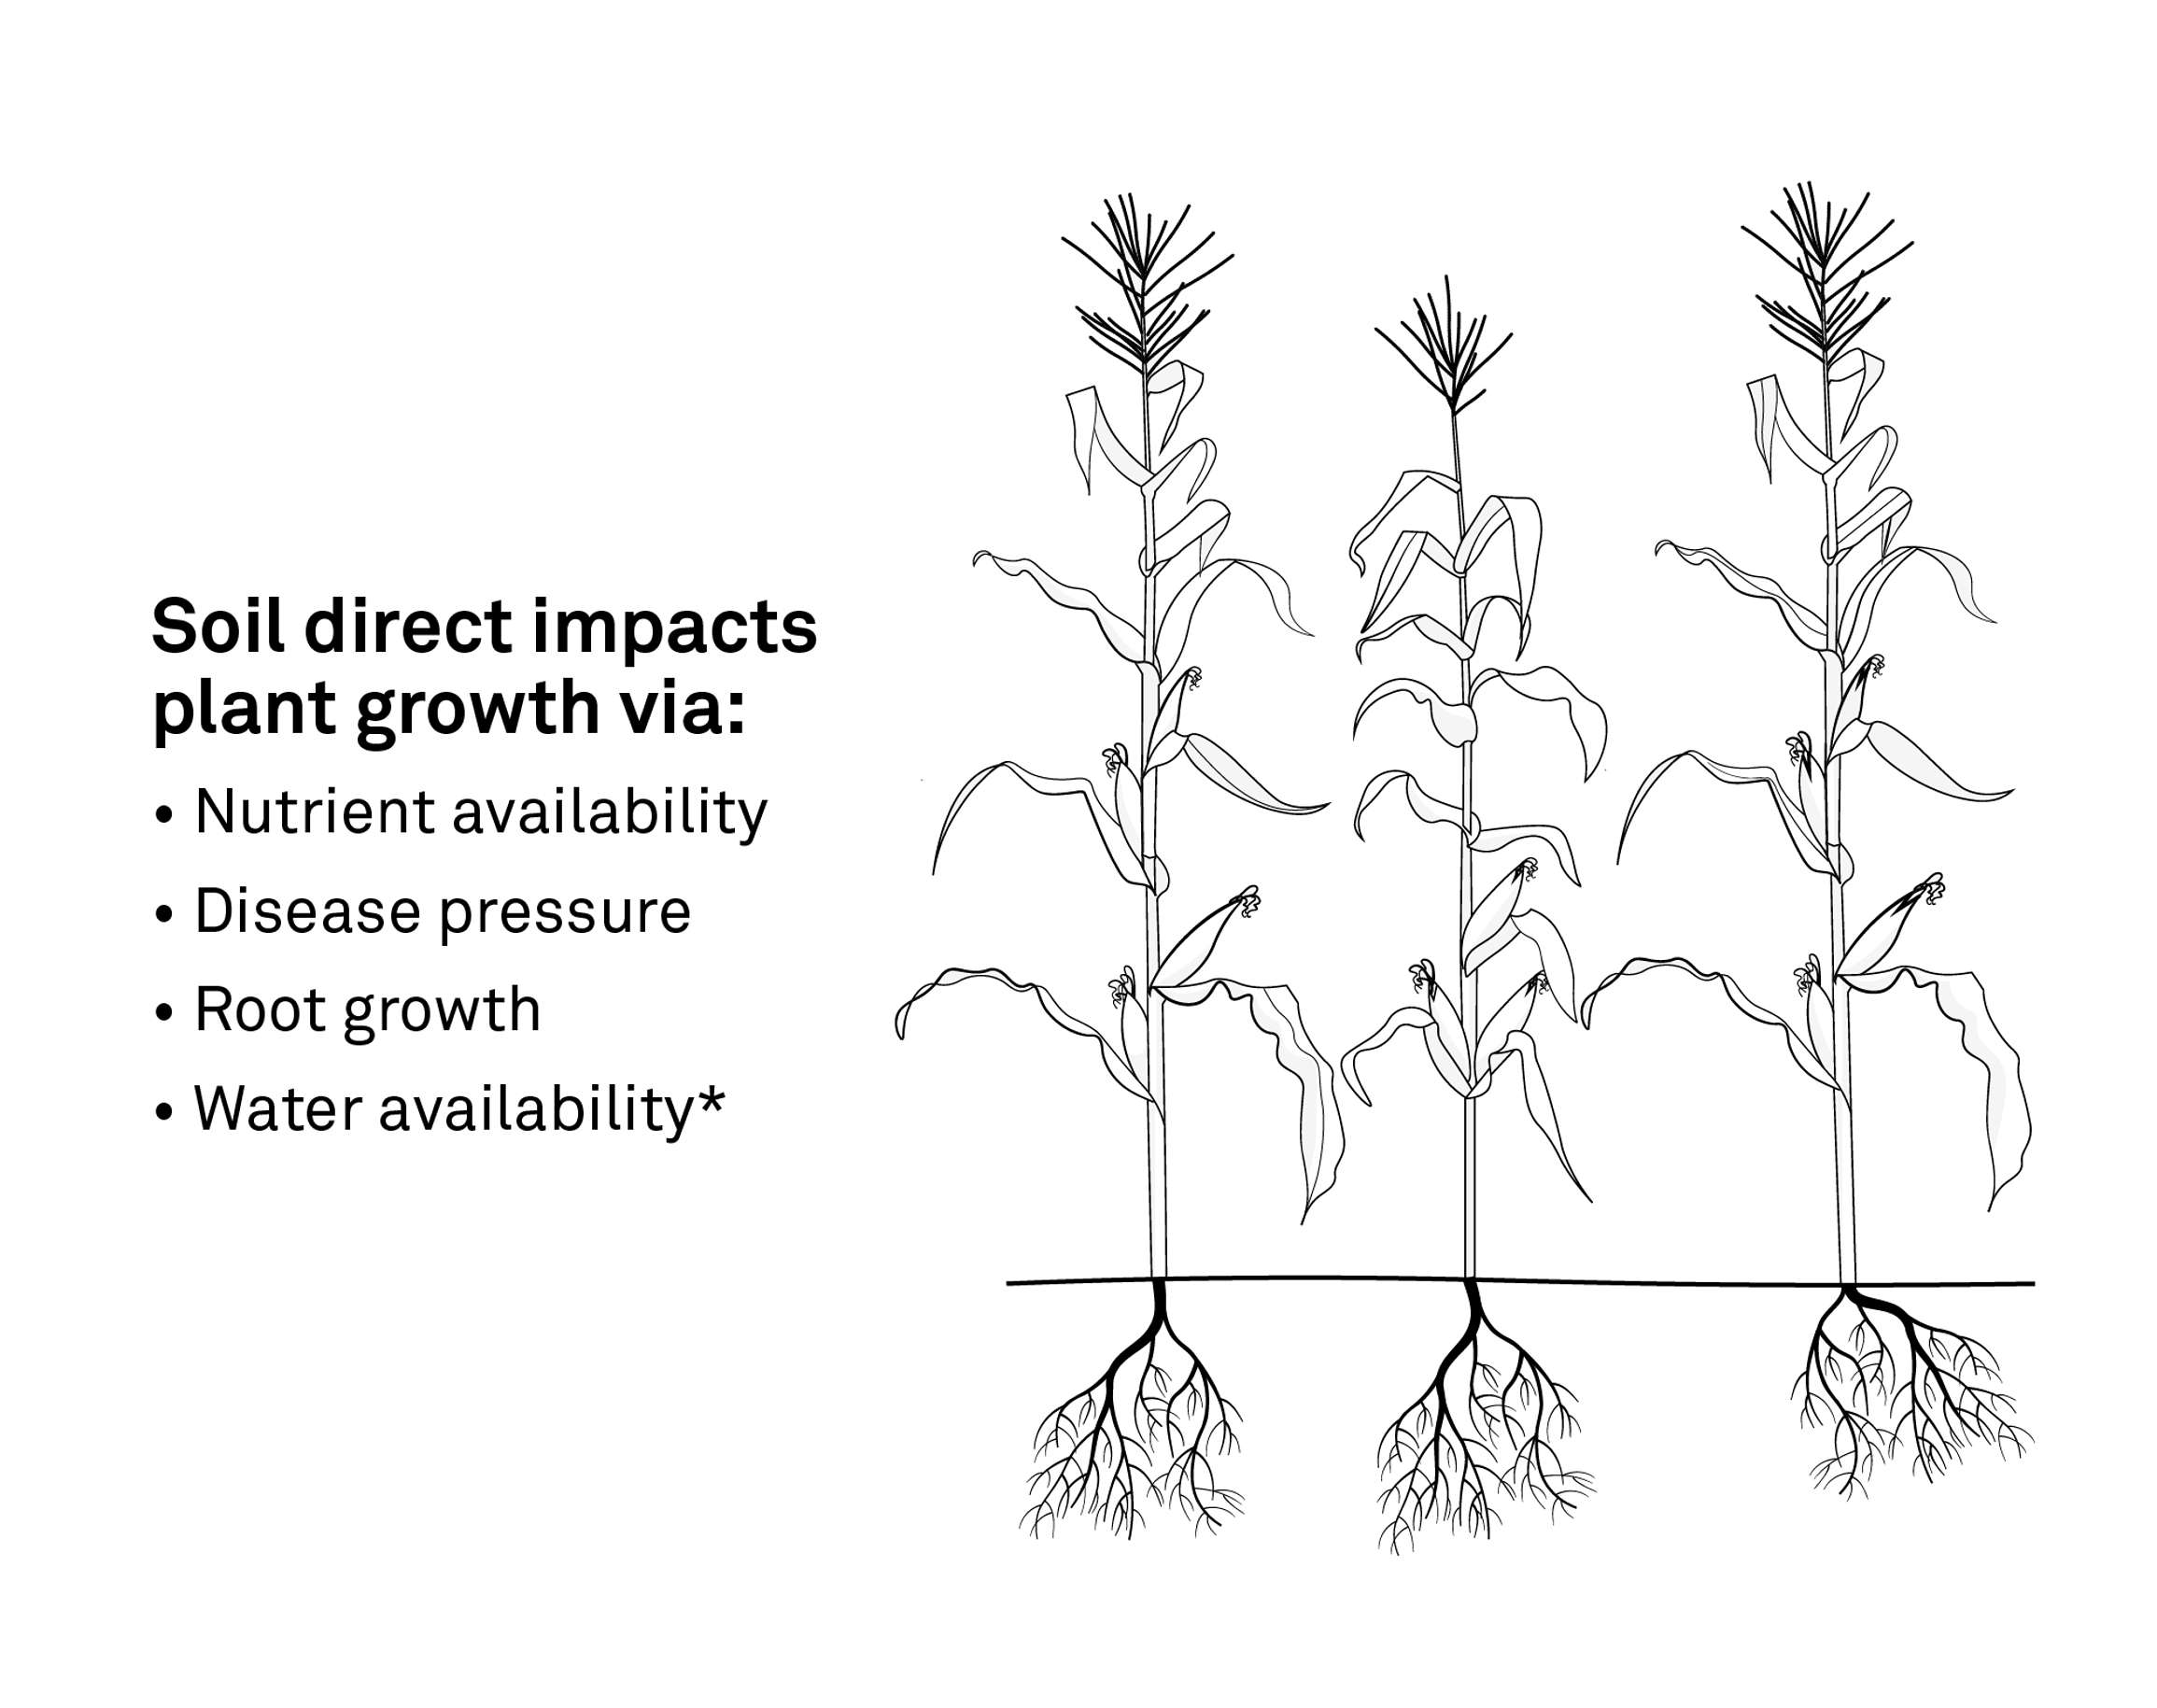
When we think about soil, it’s usually in the context of plant growth. We know that soil impacts plant growth through nutrient availability, potential disease pressure, root growth, and water availability.
Many researchers think that plant water availability can be determined with a traditional soil moisture sensor that measures volumetric water content.
But if you’re trying to characterize drought stress, understand crop water use efficiency, or study abiotic stress tolerance in plants with a water content sensor, you’re measuring the wrong parameter. Water content only tells you how much water is in the soil. It can’t tell you if that water is available to plants. Watch this short video to see why this is true.
One issue with using volumetric water content data to quantify abiotic stress, is that you need to understand the soil type and texture to interpolate information about water availability in a plant context. This makes comparisons difficult if soil types are different across multiple sites. Soil water potential, on the other hand, directly assesses water availability. That means it’s already accounting for soil texture. When you measure water potential, you have a measurement that’s directly comparable across sites and across time without the need for additional analysis or soil-specific calibration.
The other problem with using volumetric water content to indicate drought stress is that water content is only an amount. It tells you how much water has been added to (or depleted from) the soil. But it can’t tell you how accessible that water is to your plants or how much energy is needed to access that water. Water potential, on the other hand, tells you about the energy of water in the soil and if your plants are comfortable or stressed by indicating how much soil water is available to them. That’s why water potential is a much more informative measurement than water content when you want to know if your plants are experiencing true drought conditions. See how this works in the video below.
Some people avoid measuring soil water potential because it has a complicated definition that is hard to understand. But you don’t have to understand soil water potential to use it effectively. You can think of water potential as a sort of water thermometer for plants. Just as you can look at the thermostat in your house and see 22 C (72 F) and think, “that’s comfortable for me as a human being”, you can look at soil water potential data and understand whether or not the amount of water in the soil is comfortable for your plants. The video below explains why.
Figure 4 illustrates how we can think about water potential as a type of “comfort thermometer” for plants. Note that the kPa values for water potential are always reported as a negative value. One way to think about kPa is that the more negative the value, the drier the soil. A value of zero is in the fully saturated range, where -1000 kPa and below is starting to hit the permanent wilting point.
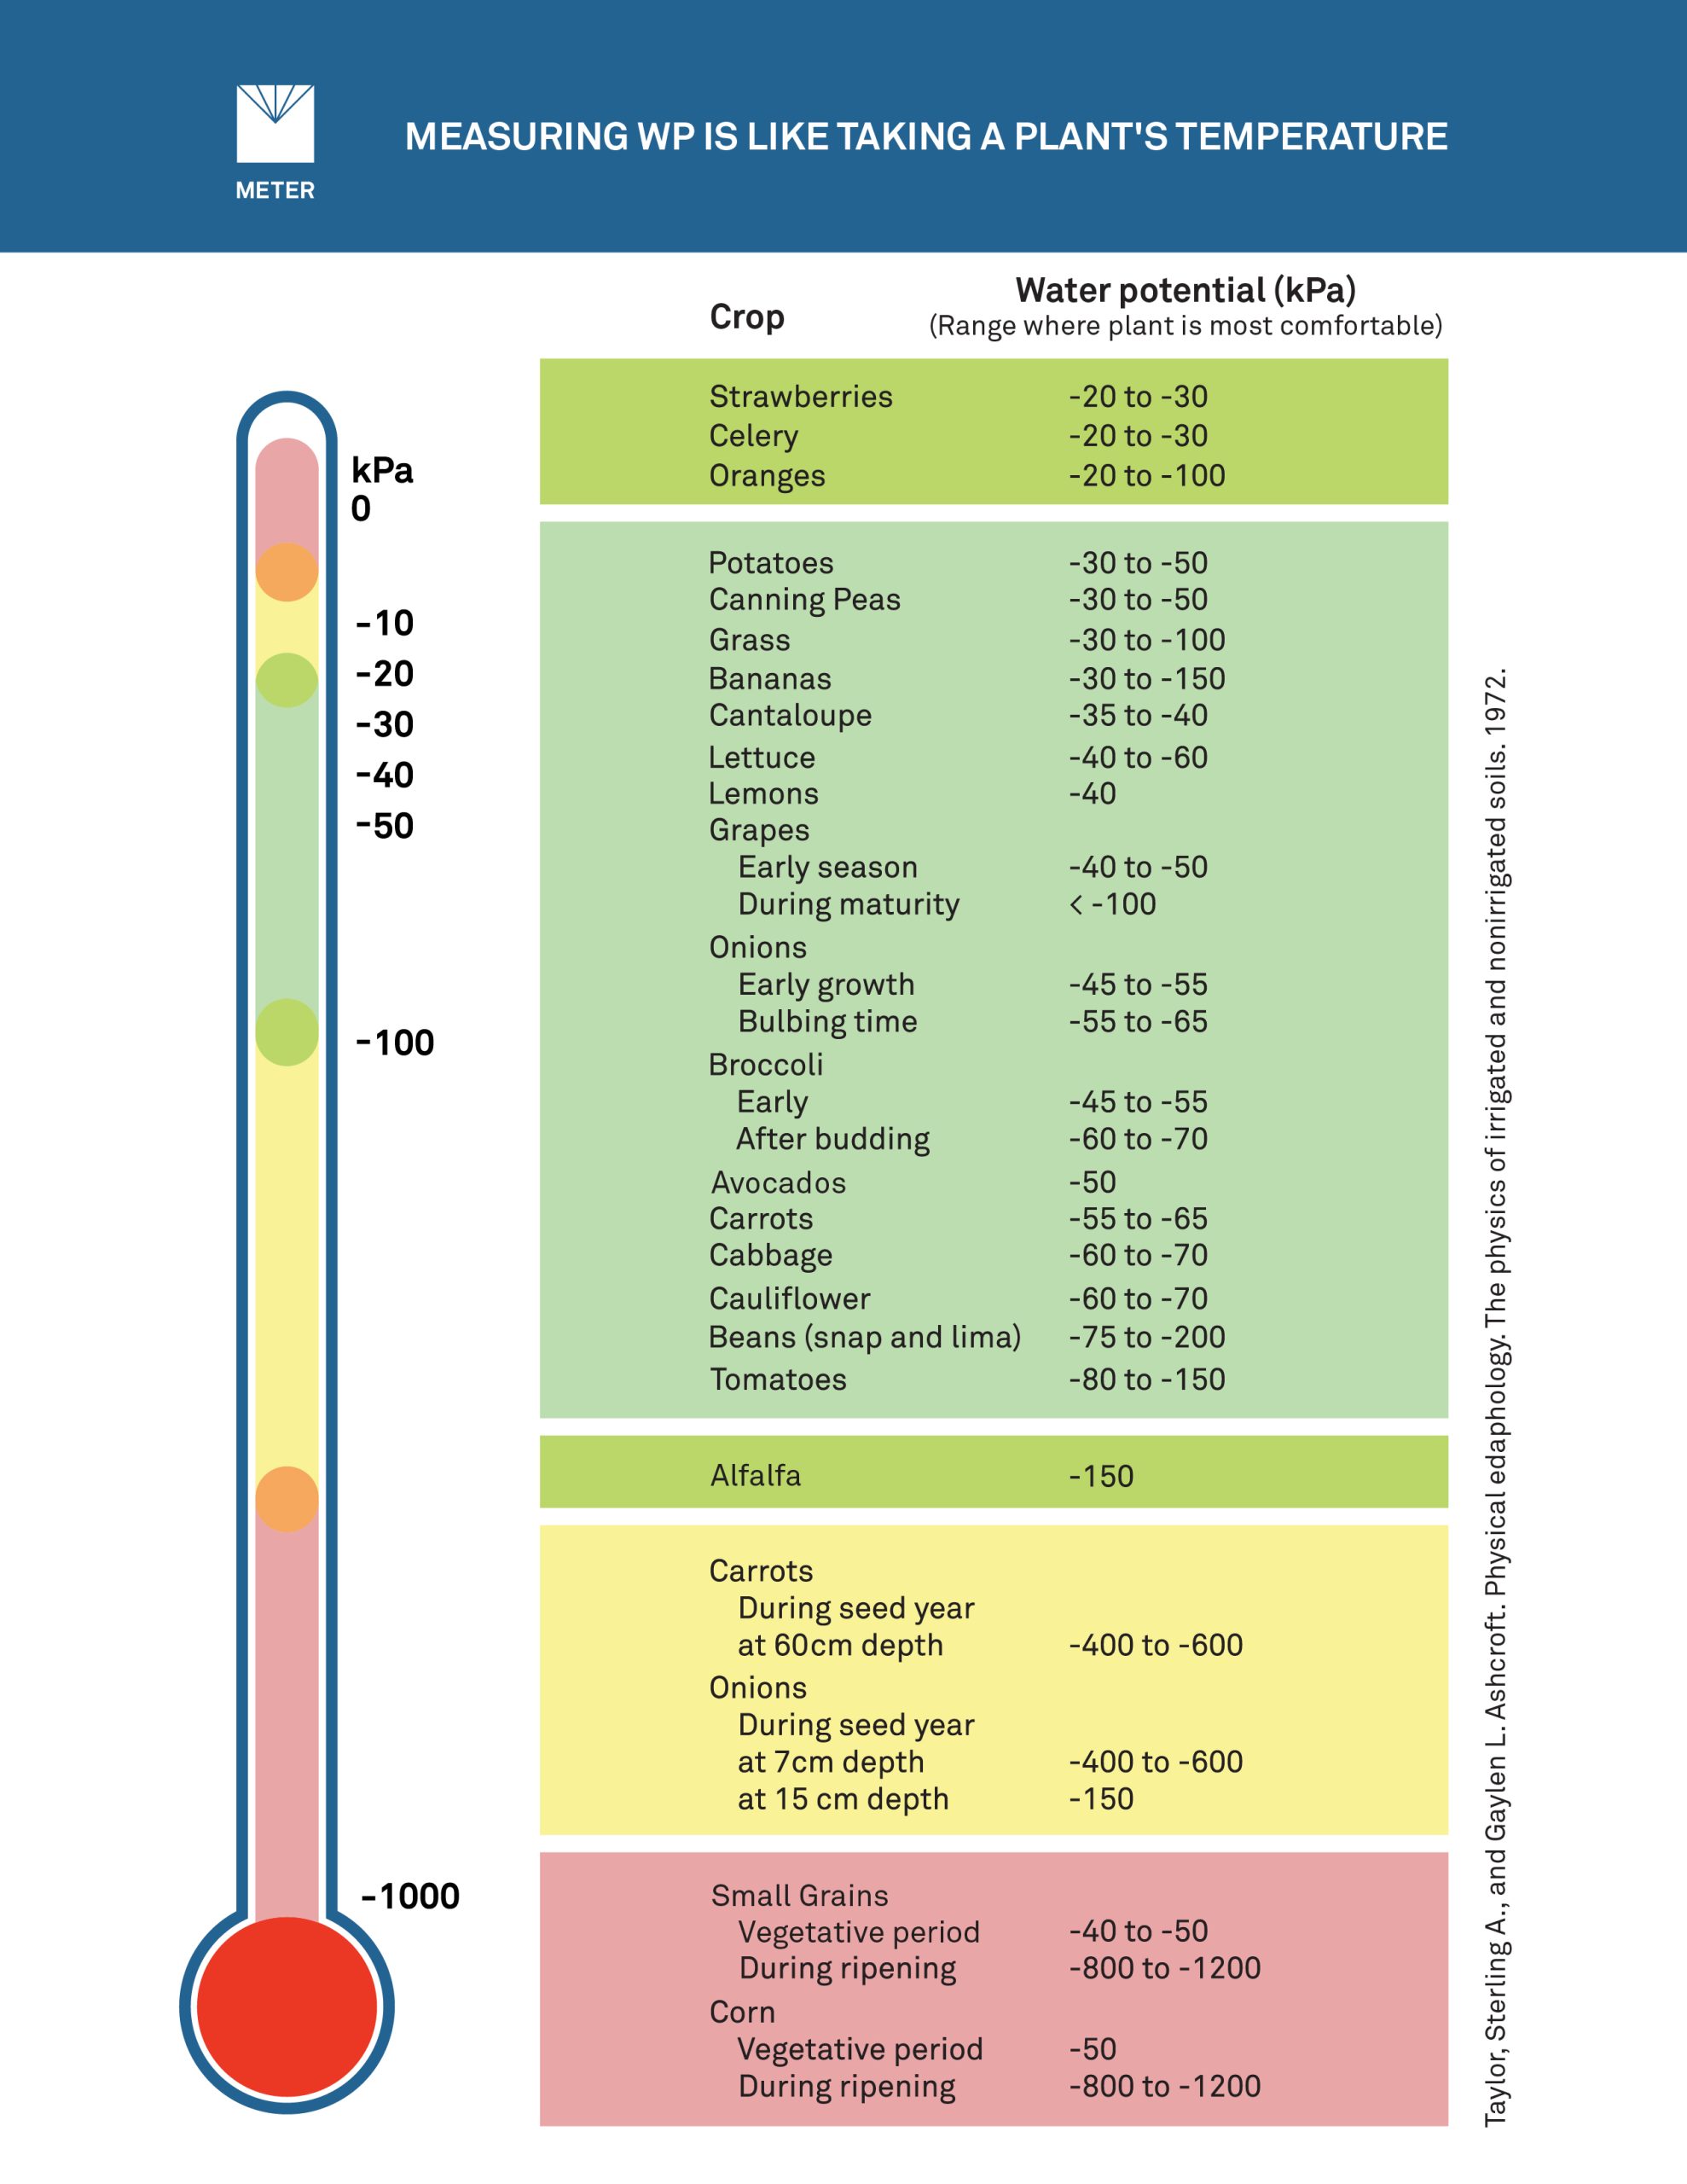
At the bottom of Figure 4, you can see that during the vegetative period, corn prefers to be up in the -50 kPa range. During ripening, however, it prefers the soil to be in the kPa range of -800 to -1200, which is quite a bit drier.
Near the top of Figure 4, you’ll see that potatoes prefer a more narrow window of about -30 to -50 kPa.
The following two graphs help illustrate how water potential data can give you a more accurate picture of water stress in plants. Figure 5 shows some volumetric water content data in turfgrass.
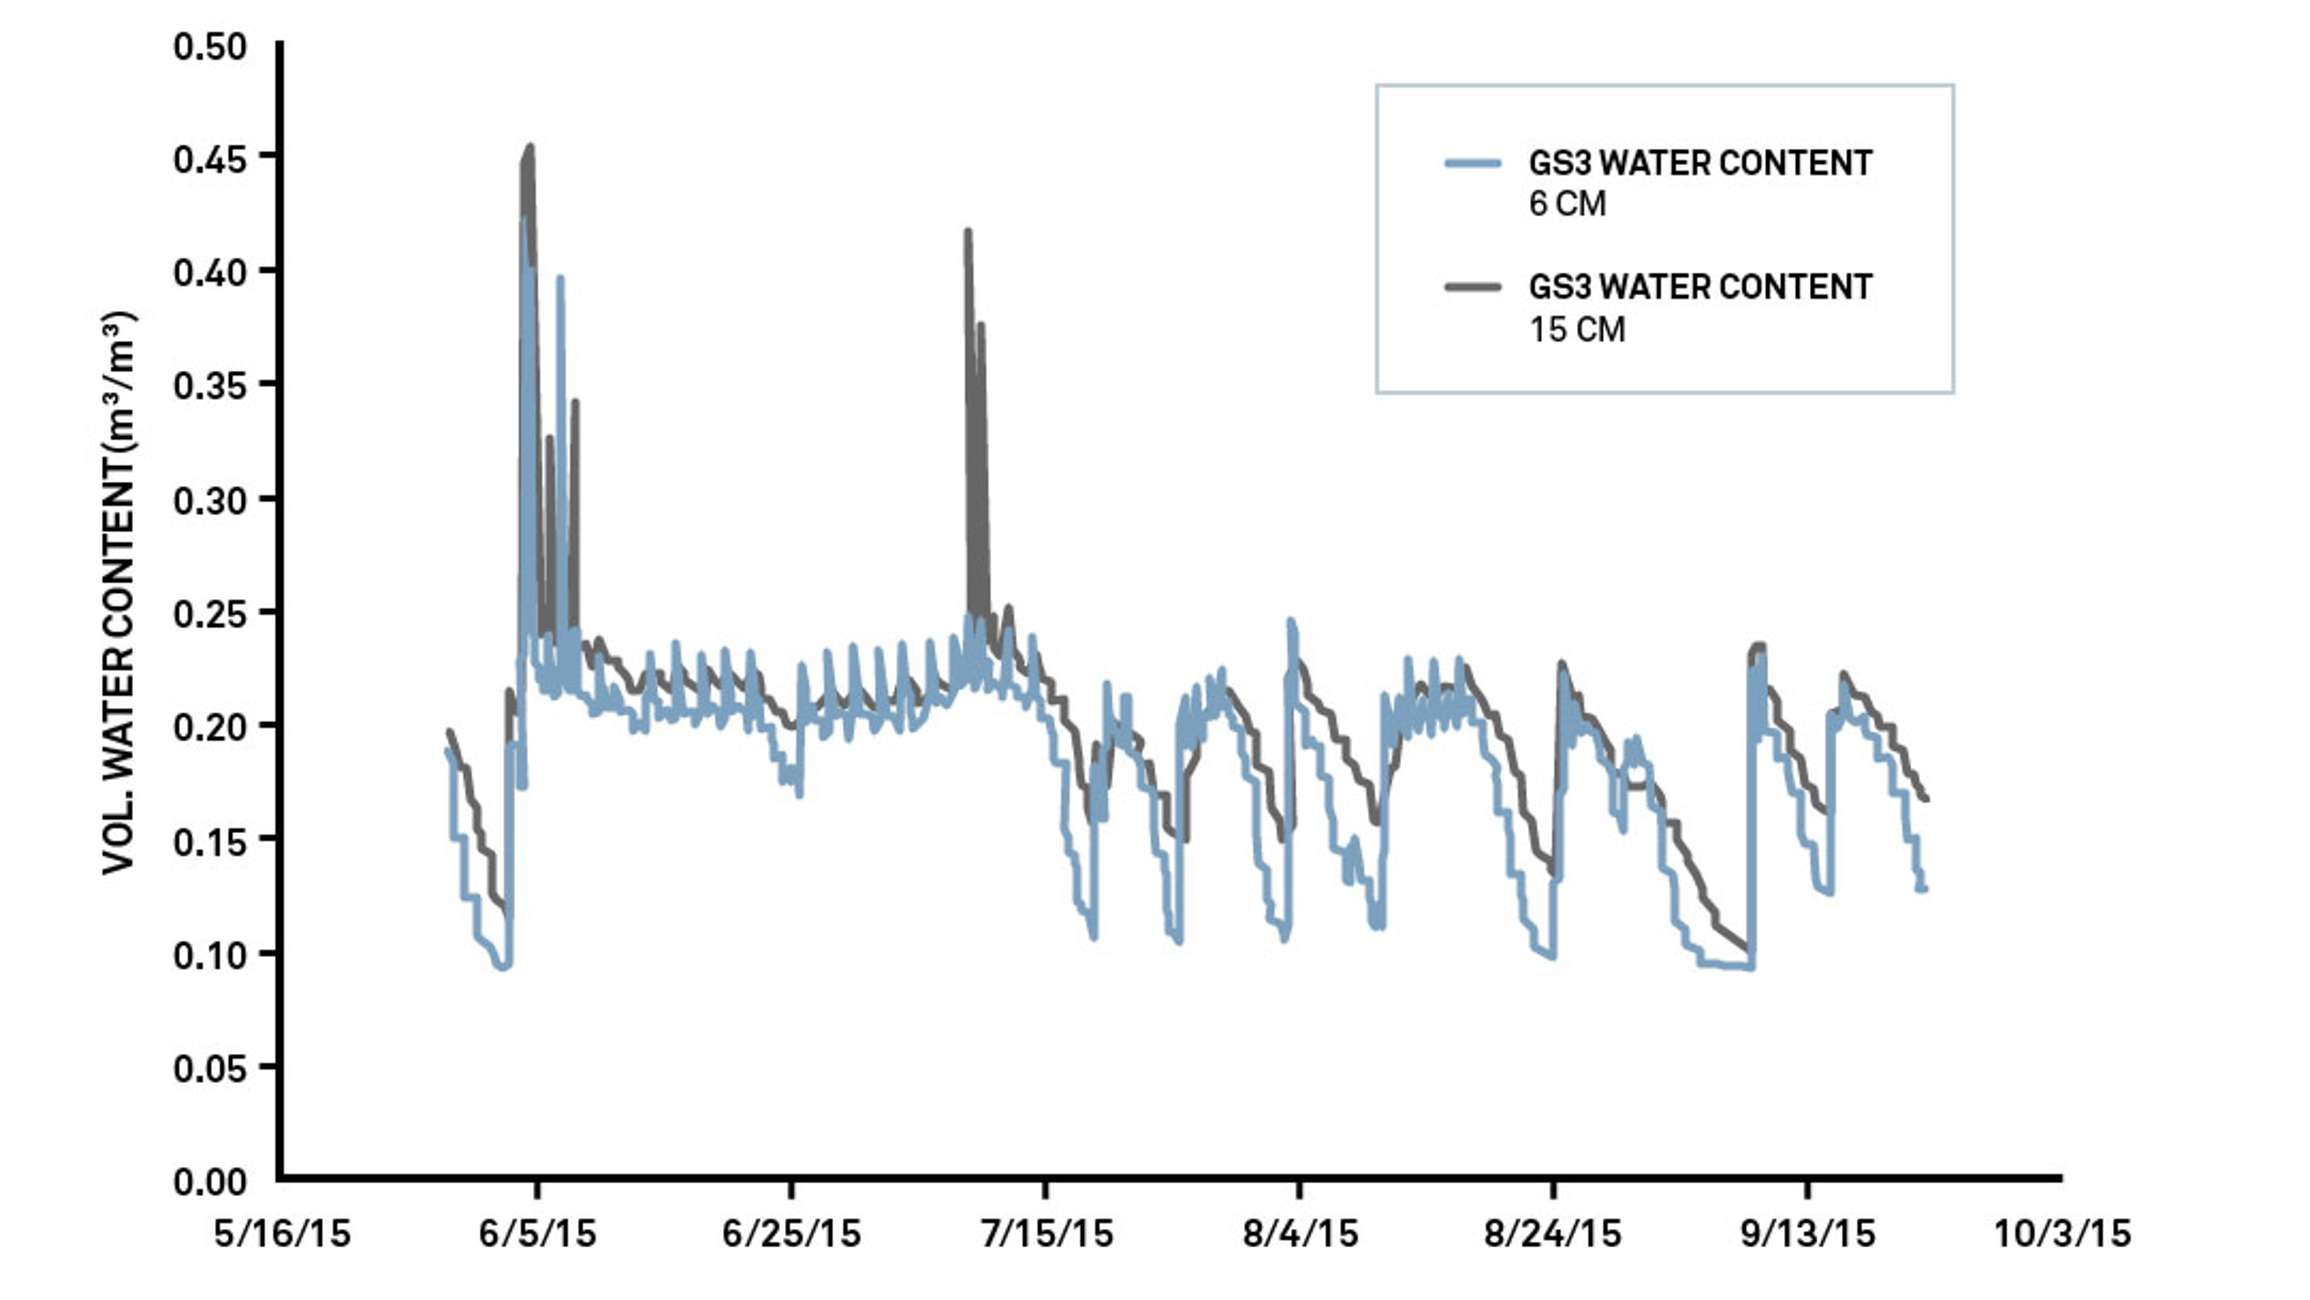
Notice the spikes in irrigation or precipitation events over time. Without any context about soil type, it’s difficult to draw conclusions about water availability or how comfortable the soil is for the turfgrass in this field.
In Figure 6, we add water potential data, which makes it much easier to see if the plants are in an optimal range for water availability.
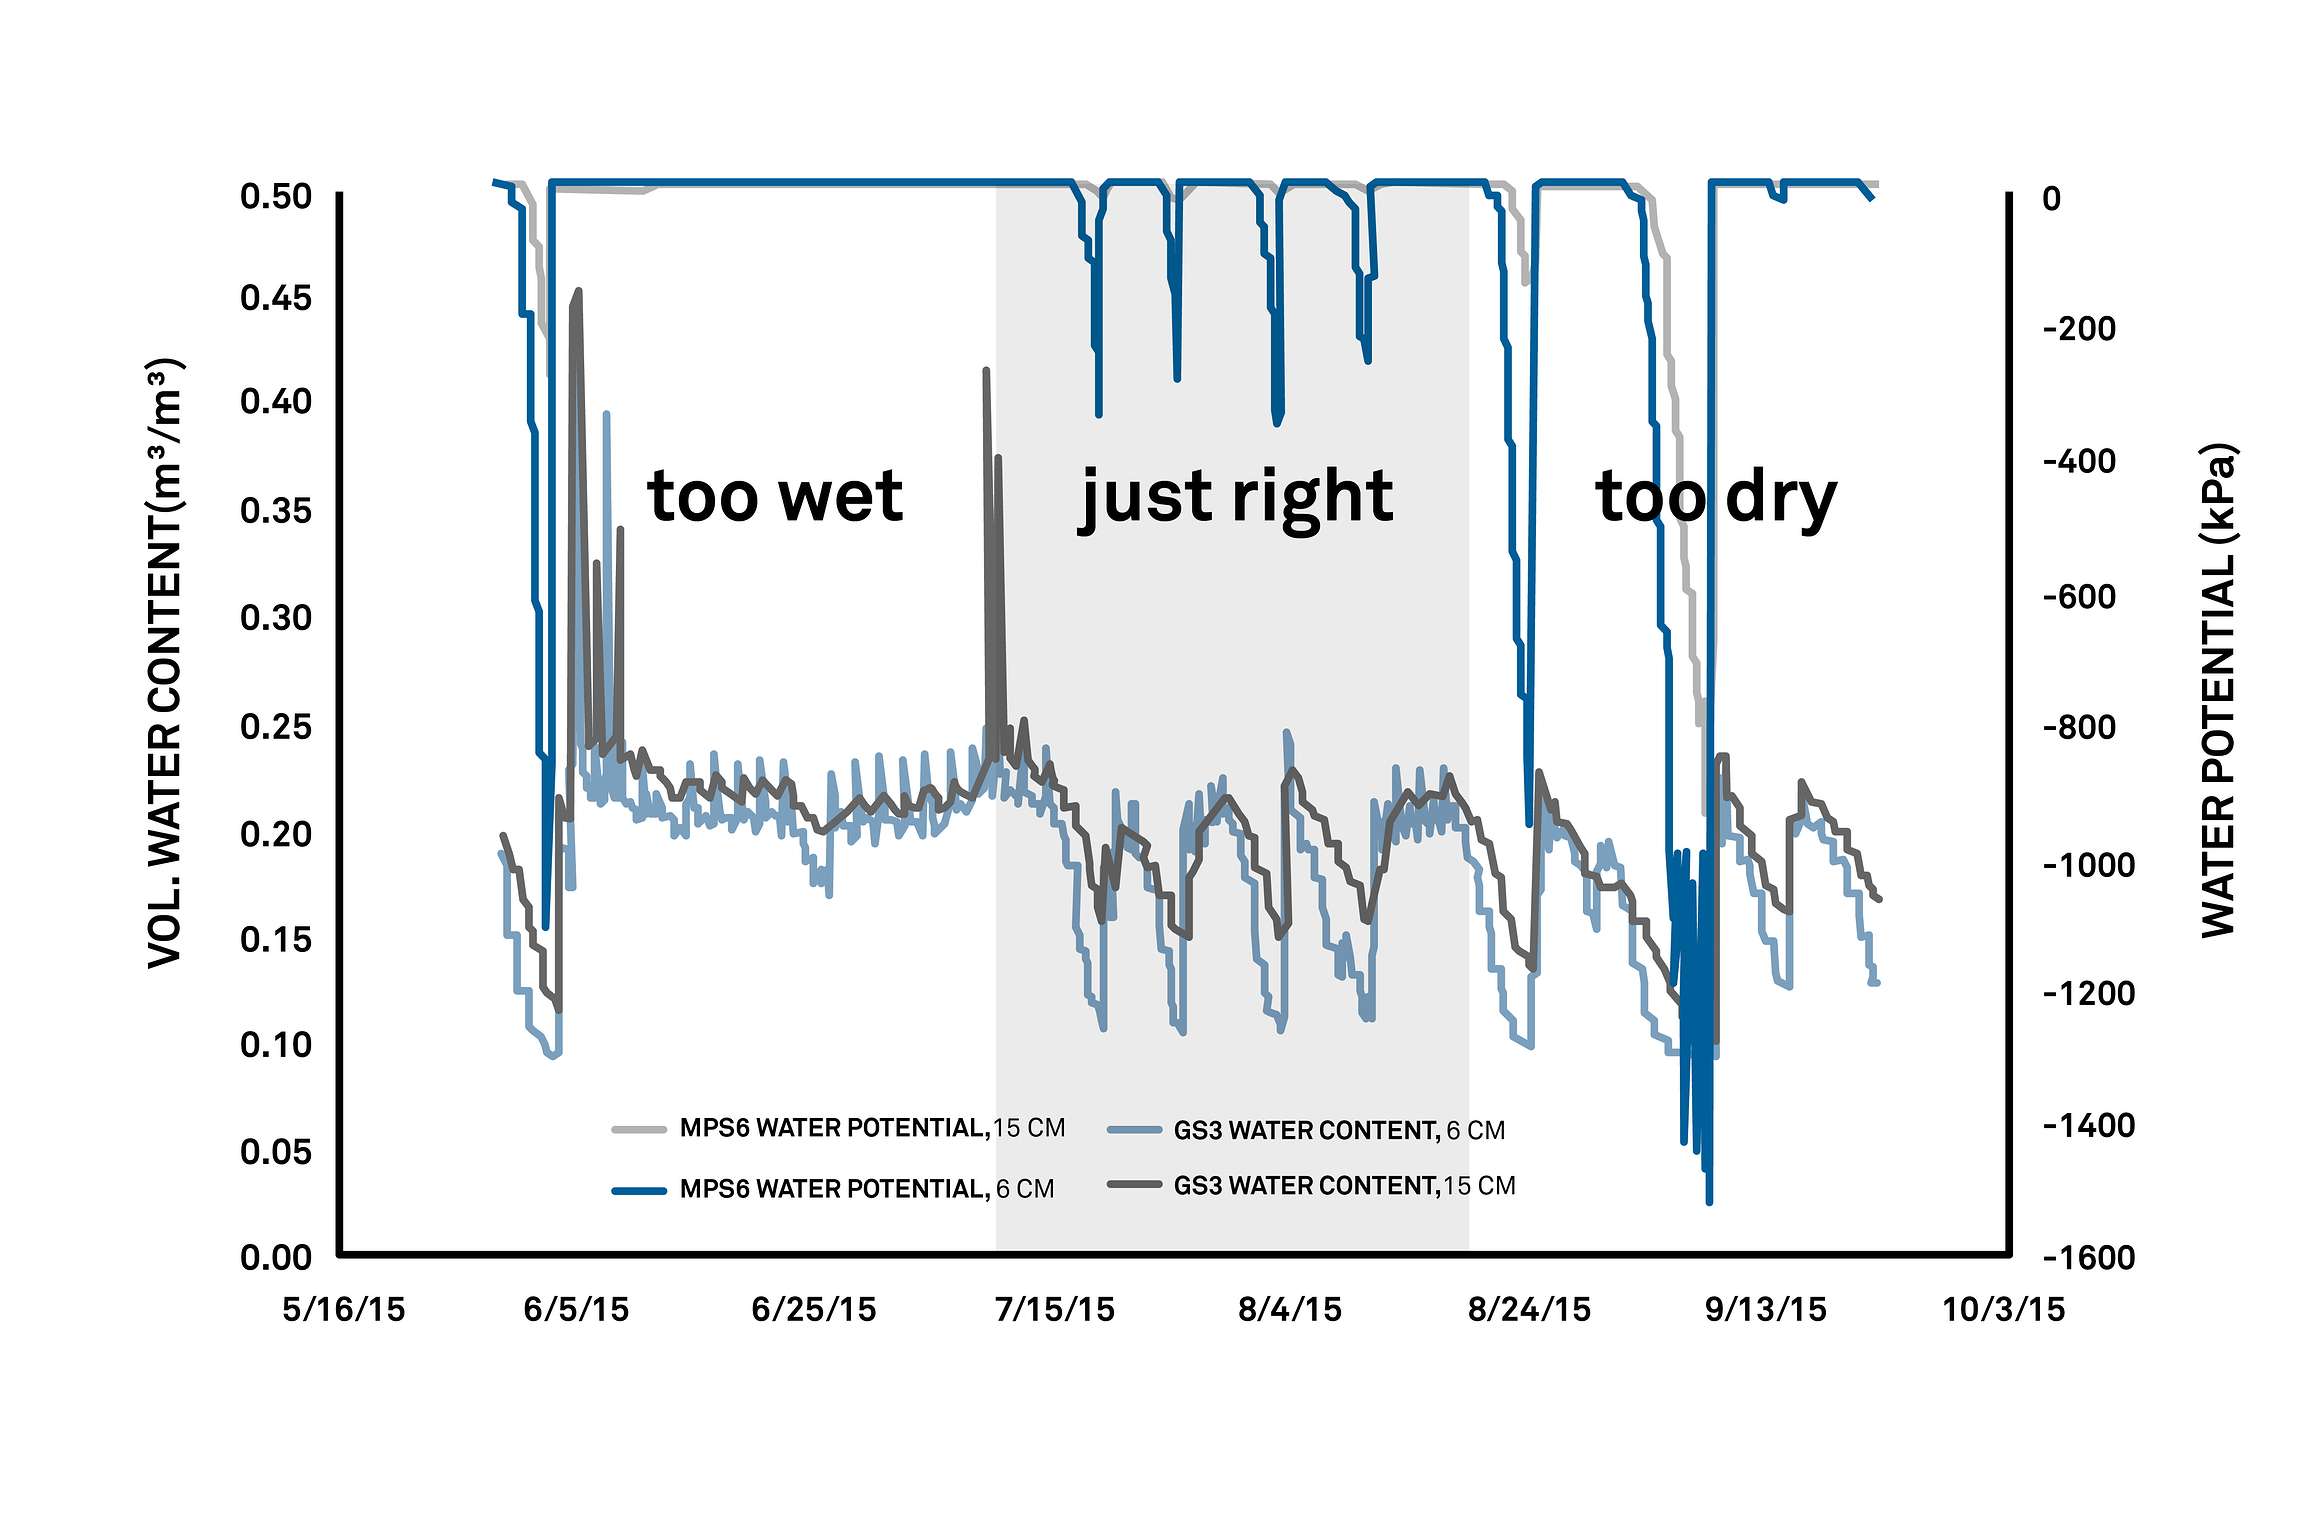
From this graph, you can see that early on in the season, they were over-applying irrigation. Around July, they reduced the irrigation frequency, which allowed the soil to dry down and move closer to the optimal -30 to -50 kPa range.
In late August and early September, you see that they started to let too much time pass in between irrigation events, which put significant drought stress on the turfgrass. The dip in water content around September 13th is not much different than the dips that occur before and after. It’s only when you see the water potential data that you notice the dramatic drop out of the optimal kPa range, which could push the turfgrass to the permanent wilting point. For more information about understanding the data, watch our webinar How to Interpret Soil Moisture Data.
Water potential, like anything else, has its limitations when used for determining drought tolerance in plants. Here are three things to consider:
When making water potential measurements, should you focus on data quantity or data quality? The answer may surprise you. A recent study looked at this trade-off in the context of plant phenotyping data. The study compared hand-measurement of field plants–a highly accurate but labor-intensive method–with plant height extraction from drone-based imagery, which generates much more (but less accurate) data. What they discovered is that you make up for sacrifices in accuracy with increased throughput capacity. In other words, it’s generally preferable to have more data points than to have fewer, more accurate data points (see Lane, H.M. and S.C. Murray. 2021. Crop Science. High throughput can produce better decisions than high accuracy when phenotyping plant populations).
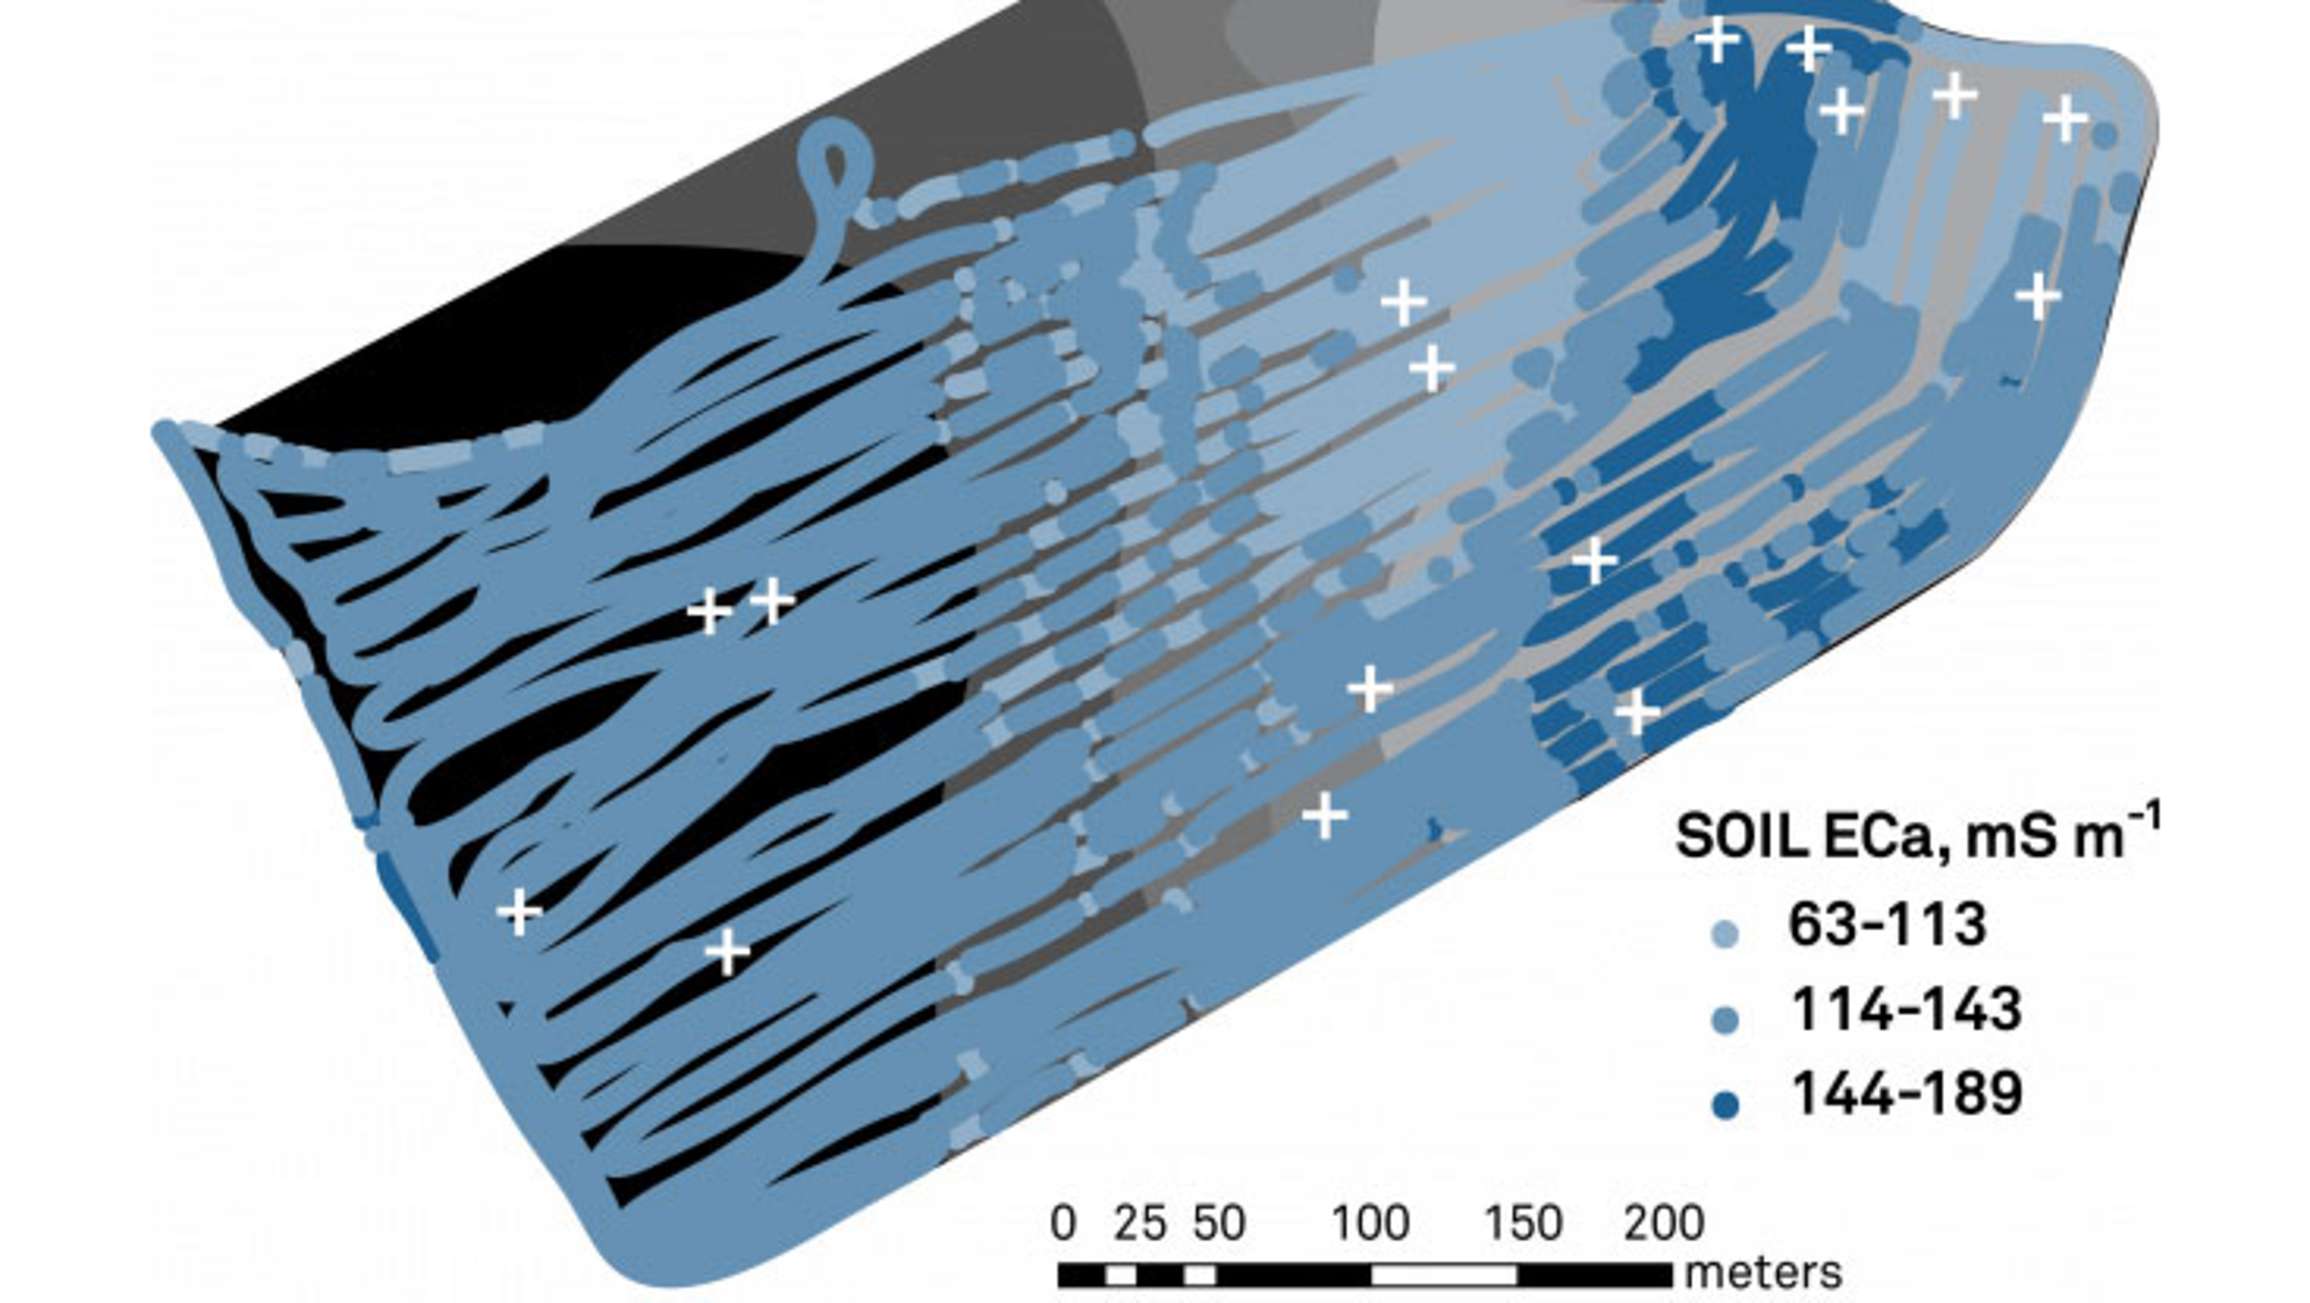
This concept of high throughput applies to capturing site variability while collecting water potential data or any other type of environmental data. For example, in Figure 8, notice how much variability we have in bulk electrical conductivity measurements. If you only had one or just a few points of sampling, you would draw some incorrect conclusions as you extrapolate across the site.
Whether you are trying to select the best variety or to better understand disease or climate resilience, your ability to accomplish your research goals is dependent on your ability to collect the right type of data. Adding water potential data to your water content data and your weather data will ensure your study is accurately assessing whether or not your plants are truly experiencing drought stress. For a deeper look at the difference between water content and water potential, watch our Soil Moisture 101 webinar.
Lane, Holly M., and Seth C. Murray. “High Throughput can produce better decisions than high accuracy when phenotyping plant populations.” Crop Science 61, no. 5 (2021): 3301-3313. Article link.
Find out why Dr. Andrew Green and his advisors, Dr. Gerard Kluitenberg and Dr. Allan Fritz, think monitoring water potential in the soil is the only quantifiable way to impose a consistent and repeatable treatment in drought stress studies.
Read the case study: “Screening for drought tolerance”
Our scientists have decades of experience helping researchers and growers measure the soil-plant-atmosphere continuum.
Water potential is a better indicator of plant available water than water content, but in most situations it’s useful to combine the data from both sensors.
Get the information you need to stress or de-stress your crop at the right time and in the right way to achieve your goals.
Hydraulic conductivity—What it is, how to measure it, and pros/cons of common methods.
Receive the latest content on a regular basis.

