Irrigation and climate impacts to the water-energy balance of the WI Central Sands

Due to controversy over the growing number of high capacity wells in the Wisconsin Central Sands, University of Wisconsin PhD student, Mallika Nocco, is researching how agricultural land use, irrigation, and climate change impact the region’s water energy balance. She and her team have uncovered some surprising results.
WATER USE DEBATE
There are class 1 trout streams in the Central Sands region, and some people worry that the increasing number of high capacity wells used for agriculture will reduce the water levels in those streams. “Lake Huron has lost about 11 feet of water since 2000,” says one resident of the Central Sands area, “and water levels are continuing to drop.” In 2008, the small well he used to pump drinking water went dry, and he blames the high capacity wells.” (Aljazeera America) On the other side of the debate, agriculture irrigated by these wells is extremely valuable to the state, and growers have taken quite a bit of time to understand the water cycle and their role in it. You can read about their water management goals and accomplishments here.
UPDATING FORMER RESEARCH
Irrigated agriculture wasn’t prevalent or profitable in the Wisconsin Central Sands until groundwater irrigation with high capacity wells became feasible in the 1950s. Since then, this relatively small ecological region has gone from 60 high capacity wells in 1960 to over 2,500 today. Mallika Nocco is studying potential groundwater recharge from irrigated cropping systems that use the wells, hoping to understand if the irrigation water is lost or returned to the groundwater. She says, “Until now, we’ve been relying on models validated by two lysimeters in the 1970s. Champ Tanner (one of the fathers of environmental biophysics) designed the weighing lysimeters, and they were very accurate, but we wanted to do a larger scale study with multiple crops to get a handle on interannual variability and to improve our understanding of recharge in the region so we can do a better job of managing irrigation and groundwater.”
MEASURING RECHARGE
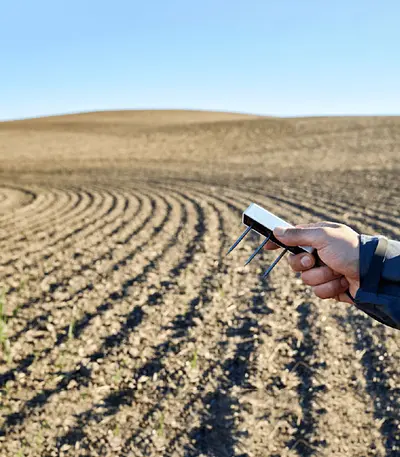
Nocco used 25 METER G3 drain gauge lysimeters to capture vadose zone flux under potato and maize cropping systems. She monitored soil moisture (and temperature) flux by stratifying METER water content sensors from the soil surface to a depth of 1.4 meters. She also estimated evapotranspiration (ET) using a METER SC-1 porometer to measure stomatal conductance, in addition to obtaining micrometeorology, leaf area index, and gas exchange measurements.
Nocco and her team had to put their sensors in to avoid cultivation, so they extended the drain gauge PVC that comes up to the soil surface and removed it any time there was major fieldwork, whether it was tillage or planting, so that the area over the lysimeter got the same treatment as the rest of the agricultural fields.
BELOW THE ROOT ZONE
Nocco says getting the lysimeters below the root zone was a major challenge. “We tried a couple of things, but we settled on installing all the lysimeters with an 18- inch auger that would drill a hole slightly bigger than the whole lysimeter. We dug an 80 cm trench to the top of the monolith zone. Then, we pounded the drain gauge divergence control tube to 1.4 m to obtain an intact monolith, wherever it was possible to do so. We also stratified soil moisture sensors at 10, 20, 40, and 80 cm. We used heavy equipment to slowly lift out the monolith, dig out the soil below, and place it back in, keeping track of all of the different soil horizons, and backfilled as close to the bulk density as we could.”
FINDING THE LYSIMETERS WITH GPS
Typically, scientists bury lysimeters close to the edge of the field so they are easy to locate, but Nocco was concerned that they would prejudice their data due to the donut effect of center pivot irrigation: more irrigation hits the center of the field with less irrigation toward the edges. She comments, ”When I installed the first ten lysimeters, I had not yet come up with a way to find everything. Those instruments are all about 15 meters from the field edge so that I could triangulate measurements and find them during cultivation. But then I met an extension scientist at the university who had access to an RTK GPS system, which can locate instrumentation within a half-inch of accuracy. With his help and training, we were able to install the rest of the lysimeters at more random spots throughout the field.”
SURPRISING CONCLUSIONS
Nocco says that ET and differences in crop physiology do not explain or account for all of the variability that she saw in groundwater recharge. Her team did a particle size analysis on the soils adjacent to the lysimeters, and she comments, “We thought that the greater the relative sand content in the soils, the more recharge we would have seen, but what we are seeing is the opposite. The particle size analysis reveals a negative linear correlation between potential recharge and sand content. The more silt there is in these lysimeters, the more volume of recharge. What I’m curious about now is if we’re seeing a greater volume of recharge in the siltier spots from flux convergence. I’m trying to obtain the time series data from the pressure transducers to see if maybe the sandier areas had less potential recharge, but perhaps drained faster. I have seen a correlation between antecedent soil moisture content and particle size (with no correlation based on crop type). So it also looks like the siltier soils are holding more water when the rain comes through.”
WHAT’S NEXT?
Eventually, Nocco plans to use field-generated estimates of groundwater recharge and ET to parameterize and validate a dynamic, agroecosystem model, Agro-IBIS, simulating hydrological responses to climate and land use changes over the past 60 years. Nocco will then share the water-energy budgets and water quantity/climate simulations with stakeholders in the Wisconsin Central Sands area.
Discover the G3 lysimeter, SC-1 porometer and METER soil moisture sensors.

Case studies, webinars, and articles you’ll love
Receive the latest content on a regular basis.

