Why soil moisture sensors can’t tell you everything you need to know
Accurate, inexpensive soil moisture sensors make soil VWC a justifiably popular measurement, but is it the right measurement for your application?

A significant body of research by leaders in leaf wetness and plant disease research suggests you should paint and calibrate leaf wetness sensors for accurate measurements (e.g., Gillespie and Duan, 1987; Lau et al., 2000; Sentelhas et al., 2004).
With the standard resistance grid leaf wetness sensor, wetness is only sensed when water droplets are large enough to bridge the gap between two fingers in the grid and lower the effective resistance. Researchers recognized this fact long ago and have tried to devise methods that would allow the sensors to detect small water droplets that are typical of the onset of dew. The methods ranged from laying cloth on top of the sensor to the current standard method: painting the sensor surface with latex paint. Instead of water actually bridging the traces, the resistance of the latex paint itself changes when wet, causing the output of the probe to change.
There is, however, one major flaw with this method that many researchers may not be aware of. In order for the latex paint to take up water and achieve a resistance change, it has to be hygroscopic in nature. As with most hygroscopic materials, the latex paint is indifferent to what state the water is in, and will absorb water vapor just as readily as liquid water. Gillespie and Duan (1987) and Sentelhas et al. (2004) suggested this effect can be minimized by baking the latex paint to remove some of the hygroscopic elements, making the sensor less sensitive to water vapor. However, even this specialized protocol doesn’t fully remove the effects of water vapor.
We collected field data with a standard resistance grid leaf wetness sensor painted with latex paint and baked according to Gillespie and Duan (1987). The air temperature and relative humidity (RH) were measured adjacent to the leaf wetness sensor, and the temperature of the leaf wetness sensors itself was measured with a fine wire thermocouple to allow calculation of the relative humidity of the sensor surface (RHs). Figure 1 shows the sensor resistance plotted against RHs. With this particular sensor, the dry resistance is about 7000 kΩ, and any resistance less than that baseline value would generally be considered to indicate a wet sensor. It is clearly apparent from the plot that even the carefully treated and baked sensor begins to give false positive results above about 70% relative humidity. In fact, it is apparent from Figure 1 that at all times when RHs is above 90%, a false positive is registered by the painted probe.
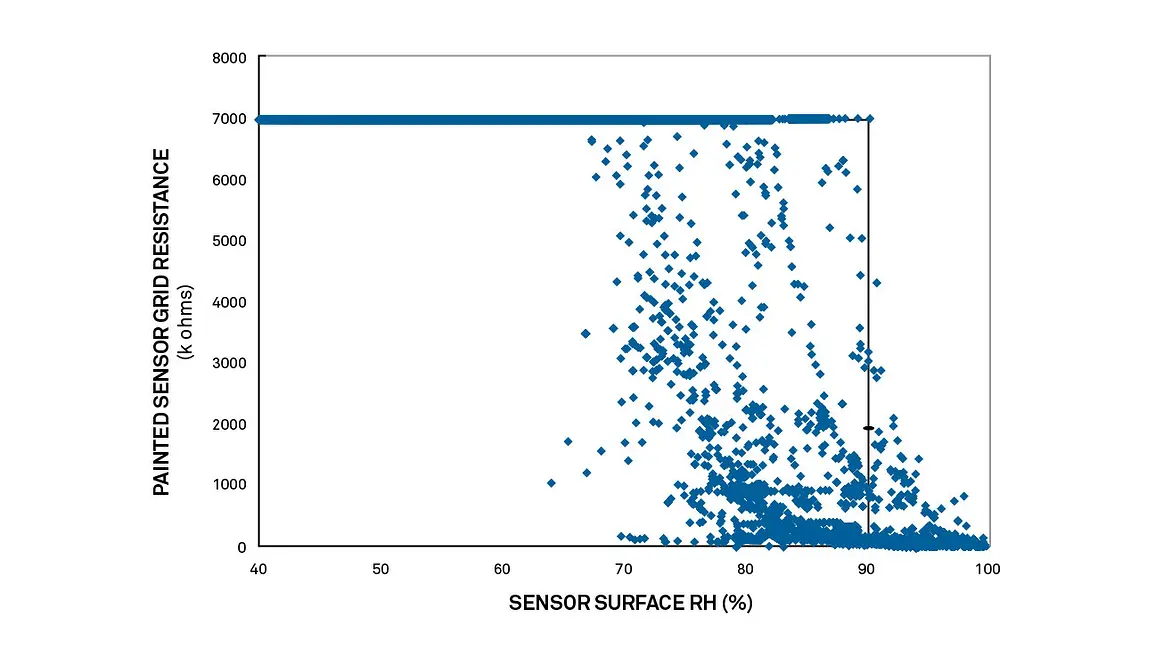
Some researchers combat the hygroscopic effects apparent in Figure 1 by individually calibrating each painted sensor. One common calibration method is to seal each sensor in an isothermal container over a pool of water and record the sensor resistance at equilibrium in the 100% RH conditions that result. This value is then taken to be the new baseline value. As one might imagine, this is a tedious and time-consuming activity.
A recently developed leaf wetness sensor (PHYTOS 31, METER) uses a different method for measuring surface wetness. Instead of measuring the resistance between metal grid fingers, the sensor measures the dielectric constant of the surface of the sensor. With the dielectric method, droplets don’t need to be large enough to bridge adjacent traces, so any amount of liquid water on the surface of the probe is measured, no matter what the droplet size. This eliminates the need for painting the sensor.
Extensive testing has shown no hygroscopic effects are present below about 98.5% RHs and that those between 98.5% and saturation aren’t large enough to register as false positive values. The dielectric leaf wetness sensors are also individually tuned before leaving the factory so that each sensor reads exactly the same, thus eliminating any need for user calibration. Figures 2 and 3 show data collected with a painted resistance grid sensor and a dielectric leaf wetness sensor respectively during onset of a typical nighttime dew event. From Figure 2, it is apparent that the hygroscopic response of the painted sensor can lead to significant overestimation of leaf wetness duration (in this case, over 1.5 hours) if the sensor is not individually calibrated after painting. Figure 3 shows data from the same dew event collected with a dielectric leaf wetness sensor with no painting or calibration by the user. The dielectric leaf wetness sensor underestimates leaf wetness duration by five minutes.


The data presented above make a convincing argument that the new dielectric leaf wetness sensor will provide more accurate results than an unpainted or painted and uncalibrated resistance grid leaf wetness sensor, with none of the hassle of painting and baking or individual calibration.
Our scientists have decades of experience helping researchers and growers measure the soil-plant-atmosphere continuum.
Gillespie, T. J., and R-X. Duan. “A comparison of cylindrical and flat plate sensors for surface wetness duration.” Agricultural and Forest Meteorology 40, no. 1 (1987): 61-70. Article link.
Lau, Yewah F., Mark L. Gleason, Narjess Zriba, S. Elwynn Taylor, and Paul N. Hinz. “Effects of coating, deployment angle, and compass orientation on performance of electronic wetness sensors during dew periods.” Plant Disease 84, no. 2 (2000): 192-197. Article link (open access).
Sentelhas, P. C., J. E. B. A. Monteiro, and T. J. Gillespie. “Electronic leaf wetness duration sensor: why it should be painted.” International Journal of Biometeorology 48, no. 4 (2004): 202-205. Article link.
Want to know more about measuring leaf wetness in your unique application? METER scientists have over 100 years combined experience helping researchers the soil-plant-atmosphere continuum. Talk to an expert
Accurate, inexpensive soil moisture sensors make soil VWC a justifiably popular measurement, but is it the right measurement for your application?
TDR, FDR, capacitance, resistance: A comparison of common soil moisture sensing methods, their pros and cons, and their unique applications.
A comprehensive look at the science behind water potential measurement.
Receive the latest content on a regular basis.

